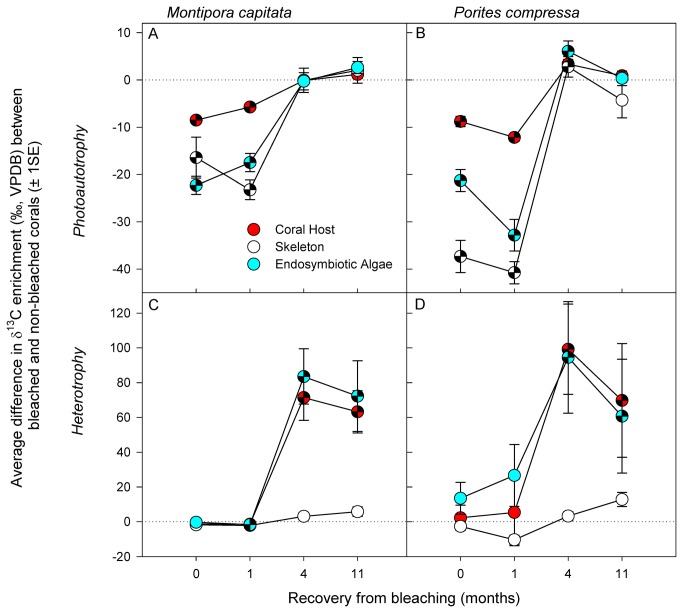
Figure 4. Relative assimilation of 13C-labelled carbon via photoautotrophy (panels A, B) and heterotrophy (panels C, D) in Montipora capitata (A, C) and Porites compressa (B, D) corals.
Values represent the average of the difference between the enrichment values of the control and the bleached corals for each genotype and for each tissue type (coral host = red; skeleton = white; endosymbiotic algae = blue). The dashed line represents no difference between the control and the bleached corals in terms of their total isotopic enrichment. Chequered symbols below the dashed line indicate that carbon assimilation by bleached corals was significantly less than that of non-bleached control corals. Chequered symbols above the dashed zero line indicate that carbon assimilation by bleached corals was significantly in excess of that by non-bleached control corals.

