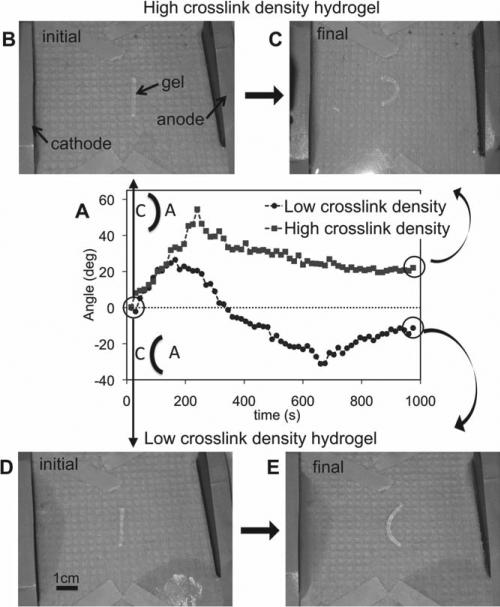
Figure 3.
(A) Time evolution of the bending angle for low crosslink density (circles) and high crosslink density (squares) hydrogels. Schematic of the bending configuration for positive and negative angles is given, where A and C stand for anode and cathode, respectively. The initial and final, steady-state configuration of the high crosslink density hydrogel (B,C) and low crosslink density hydrogels (D,E) are also shown.

