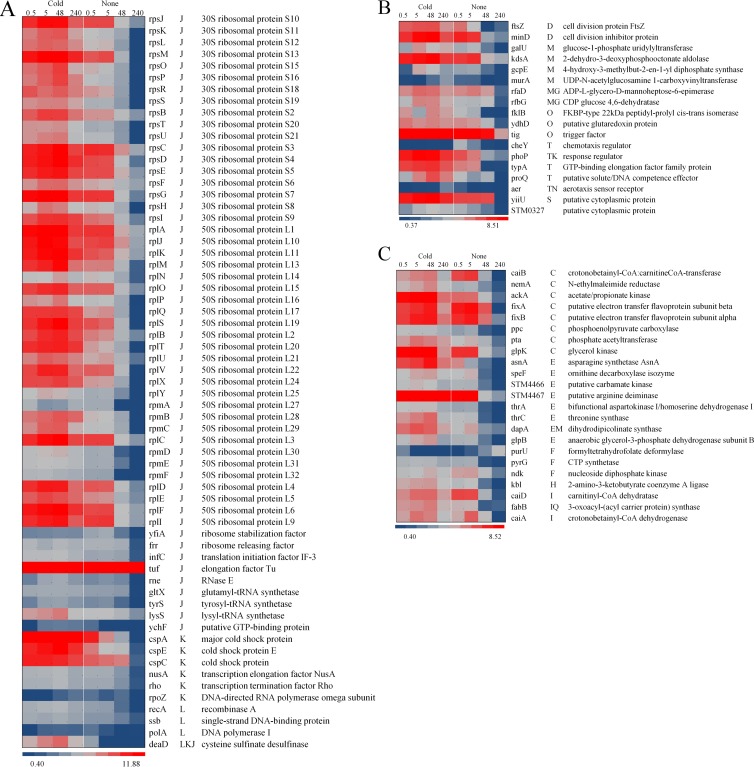
Fig 2.
Heat map representations of the 104 differentially regulated proteins (q < 0.05) due to cold stress (5°C) over time (0.5 h, 5 h, 48 h, and 240 h, as indicated above the map). The proteins are grouped on the basis of the COG functional annotation. (A) Proteins related to information storage and processing (COGs J, K, and L); (B) proteins related to cellular processes (COGs D, O, M, N, P, and T). (C) Proteins related to metabolism (COGs C, E, F, H, G, I, and Q). The blue-gray-red color scale corresponds to low expression intensity to high expression intensity. CoA, coenzyme A.

