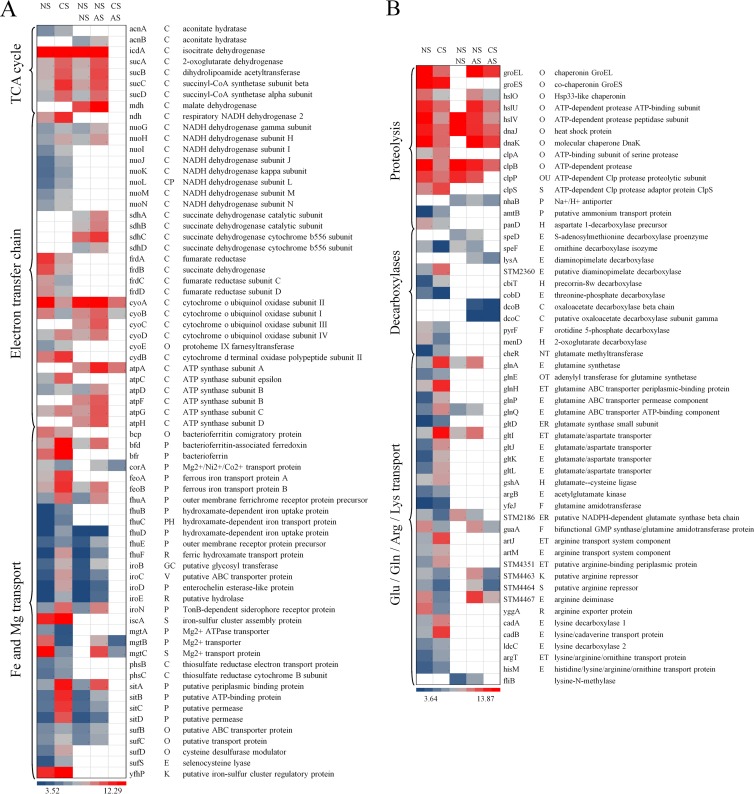
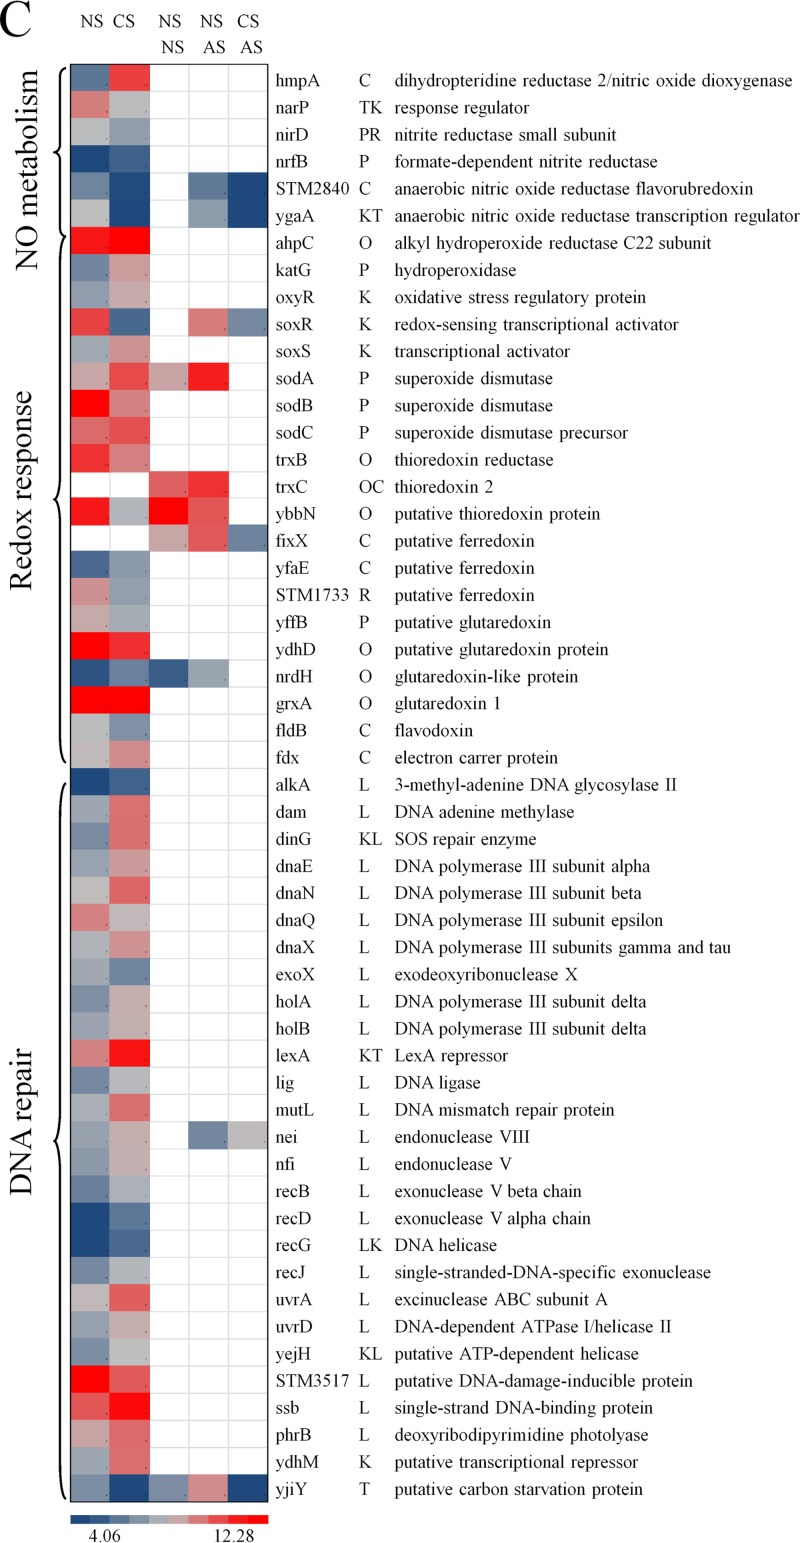
Fig 4.
Heat map representations of genes differentially regulated (q < 0.05) due to cold stress (5°C, 5 h) and acid stress (pH 4.0, 90 min) and due to preadaptation to cold stress (5°C, 5 h) followed by subsequent exposure to acid stress (pH 4.0, 90 min). Abbreviations: NS, no stress; CS, cold stress; AS, acid stress. In each heat map, the first two columns represent significant (q < 0.05) differences in gene expression due to cold stress (5°C, 5 h) alone; the third and fourth columns represent significant (q < 0.05) differences in gene expression due to acid stress (pH 4.0, 90 min) alone; the fourth and fifth columns represent significant (q < 0.05) differences in gene expression due to preadaptation to cold stress and subsequent exposure to acid stress (pH 4.0, 90 min). The blue-gray-red color scale corresponds to low expression intensity to high expression intensity. An empty white block or no color means that the particular gene for that respective comparison was not significantly (q < 0.05) differently regulated.


