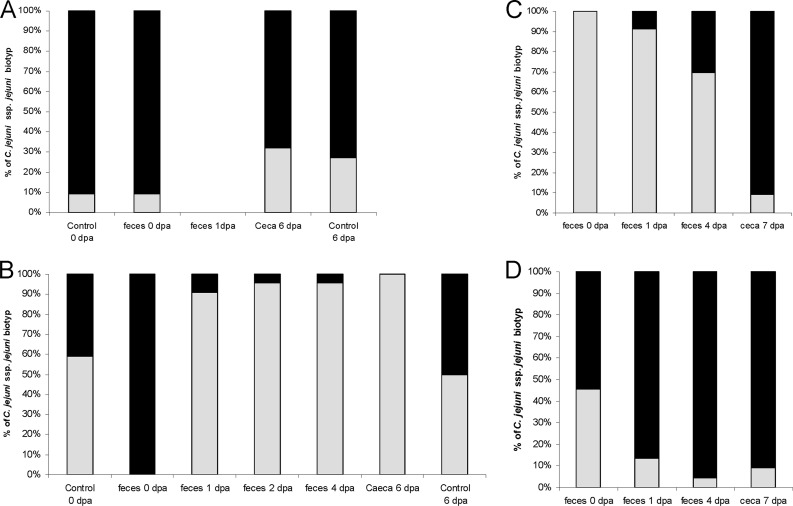
Fig 2.
Proportions of Campylobacter jejuni subsp. jejuni subtypes 1 and 2 at different days post-phage application (dpa). In field trials 1 (A) and 2 (B), experimental group proportions are shown for every sampling, whereas for the control just first and last samples are shown (first and last bars). For field trial 3, experimental (C) and control (D) groups are shown separately because in both groups phages were reisolated. For each bar, 22 isolates were analyzed. Gray bars, C. jejuni subsp. jejuni subtype 1; black bars, C. jejuni subsp. jejuni subtype 2.

