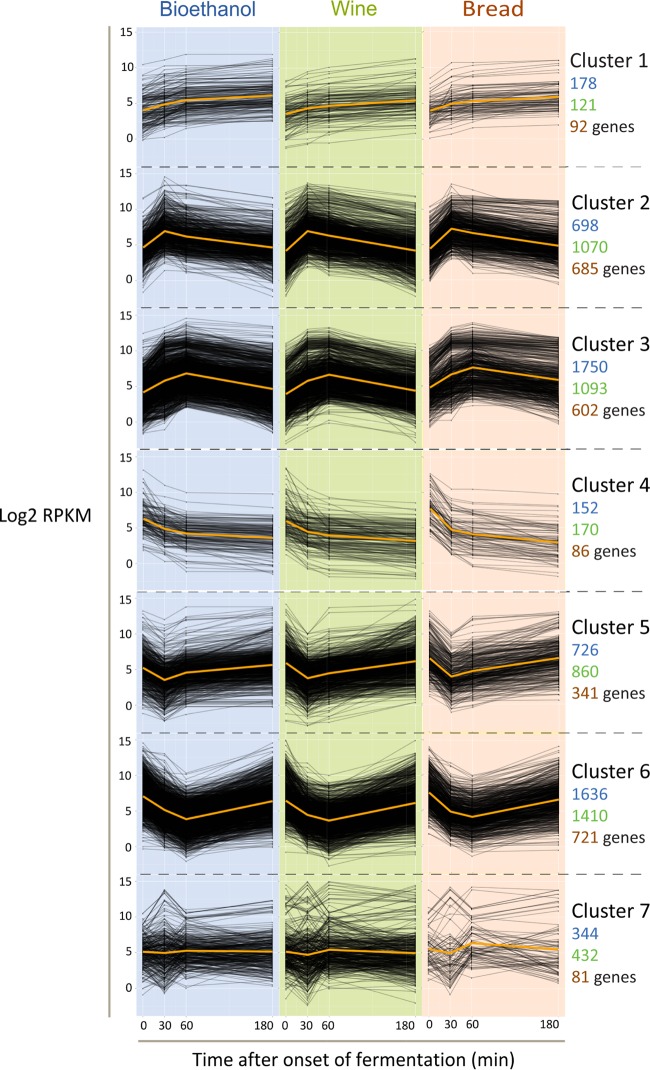
Fig 3.
The majority of differentially expressed genes display a transient response. Shown are the normalized expression levels for each gene across the fermentation process (black lines). The genes are grouped per yeast strain (commercial baker's yeast, wine yeast, or bioethanol yeast) based on similarities in expression patterns (i.e., the trend in gene expression from one time point to another). Note that number of genes in different expression categories for all 3 strains includes both protein-coding and RNA-coding genes.

