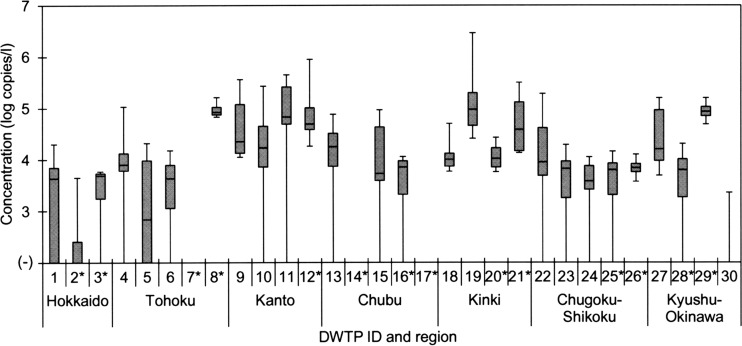
Fig 1.
Concentration of PMMoV in source water samples at 30 DWTPs in Japan. Lines within the boxes represent median values; the upper and lower lines of the boxes represent 25th and 75th percentiles, respectively, and the upper and lower bars outside the boxes represent the maximum and minimum values, respectively. Source water samples were collected 4 and 8 times from each DWTP, indicated with and without an asterisk, respectively.

