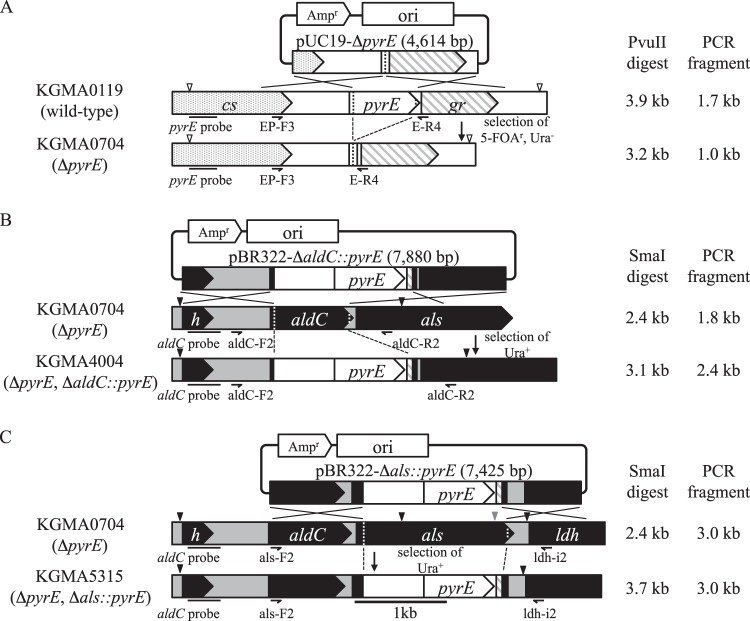
Fig 3.
Schematic diagrams of the isolation of specific gene disruptants. (A) Disruption of pyrE. The arrowheads indicate PvuII recognition sites. (B) Disruption of aldC. The arrowheads indicate SmaI recognition sites. (C) Disruption of als. The black and gray arrowheads indicate SmaI and EcoRI recognition sites, respectively. The construction of each disruption vector and the procedure for transformation are described in Materials and Methods. The genotypes of all strains were investigated by PCR and Southern blot analysis (Fig. 4) using appropriate primers and probes as shown, in addition to sequencing analyses. See the legend to Fig. 1 for a description of each gene.

