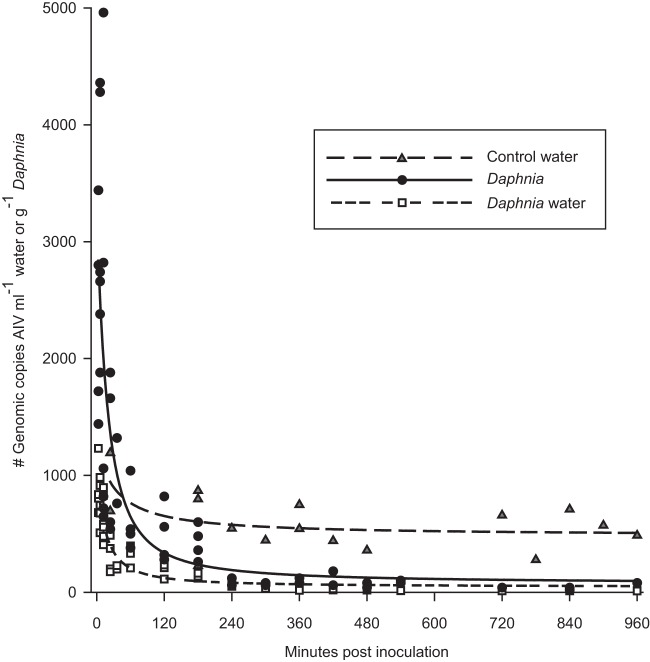
Fig 1.
AIV concentration (genomic copies ml−1) in water incubated with live Daphnia organisms and in water without daphnids (control water) and AIV concentration associated with live Daphnia tissue (genomic copies g−1) as a function of time since virus addition (X, in minutes; range, 3 to 960 min). Points represent raw data, and lines depict predicted [AIV] from the top approximating model: AIV = aeb/(X + c). The model coefficients are control water (a = 482.67, SE = 135.48; b = 52.27, SE = 130.25; c = 53.81, SE = 166.7), Daphnia water (a = 44.63, SE = 23.78; b = 177.40, SE = 89.44; c = 56.46, SE = 20.88), and Daphnia tissue (a = 72.38, SE = 123.01; b = 310.18, SE = 372.66; c = 81.55, SE = 65.67).

