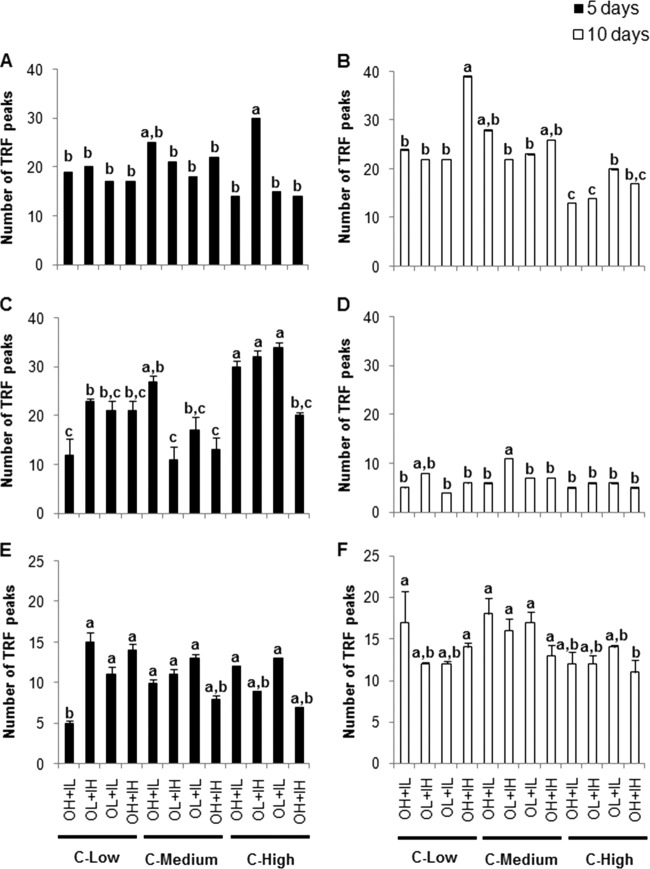
Fig 5.
Numbers of peaks of 16S rRNA gene T-RFLP profiles after 5 and 10 days of incubation. (A and B) After 5 days (A) and after 10 days (B) with humic matter as the organic nitrogen source. (C and D) After 5 days (C) and after 10 days (D) with bacterial protein as the organic nitrogen source. (E and F) After 5 days (E) and after 10 days (F) with algal exudate as the organic nitrogen source. The values are means and standard errors. Different letters above the bars indicate significant differences (P < 0.05).

