
Fig 4.
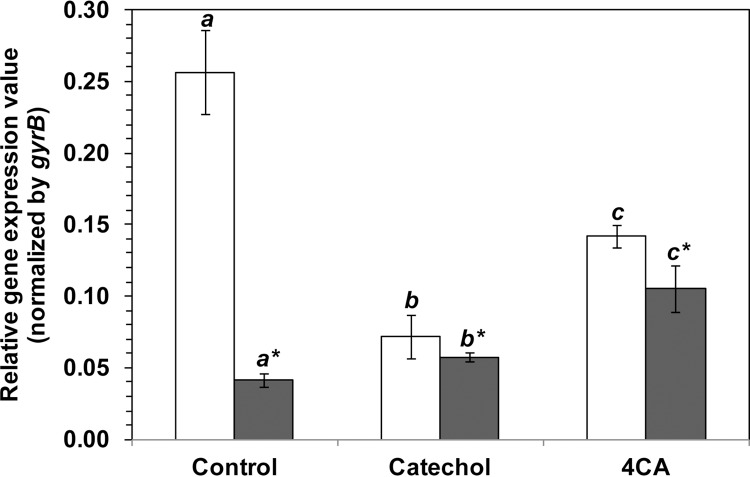
qrt-RT-PCR analysis of ctpL mRNA expression in PAO1. Cells grown overnight in 2× YT medium were used as an inoculum for cell growth in 11 mM glucose-containing T0 (open bars) or T5 (solid bars) medium, each in the presence of the solvent only (Control), catechol (2 mM), or 4CA (1 mM). After 6 h of incubation, total RNA was isolated and qrt-RT-PCR analysis of the ctpL and gyrB transcript levels was performed. The results are expressed as the relative ctpL gene expression value after normalization to the gyrB transcript level. Data are shown as the mean ± 1 SD and are derived from at least three independent experiments. Italic letters (with and without an asterisk) indicate a significant difference (P < 0.05) from the control within the same group, according to the Student-Newman-Keuls posttest.