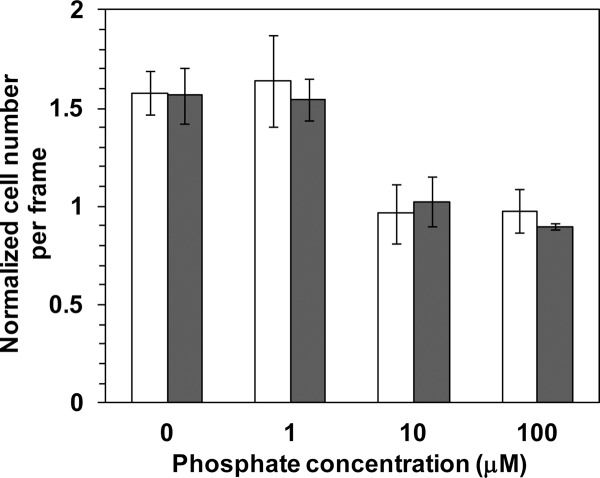
Fig 5.

Quantitative analysis of the chemotactic response of PAO1 to 2 mM catechol (open bars) and 1 mM 4CA (solid bars) in the presence of different Pi concentrations in the chemotaxis buffer using a computer-assisted capillary assay. Cells grown overnight in 2× YT medium were cultured in T0 or T5 medium, as indicated in the text, and then resuspended in the chemotaxis buffer with various concentrations of Pi (KH2PO4). The strength of the chemotactic attraction was determined by the increase in the cell number in the analysis frame area at t60 (60-s exposure) normalized to that at t0 (Nt60/Nt0). Data are shown as the mean ± SD and are derived from at least three independent experiments conducted in triplicate.
