

Abstract
Environmental anaerobic ammonium oxidation (anammox) was demonstrated for the first time in 2002, using 15N labeling, in homogenized sediment from the Skagerrak, where it accounted for up to 67% of N2 production. We returned to some of these original sites in 2010 to make measurements of nitrogen and carbon cycling under conditions more representative of those in situ, quantifying anammox and denitrification, together with oxygen penetration and consumption, in intact sediment cores. Overall, oxygen consumption and N2 production decayed with water depth, as expected, but the drop in N2 production was relatively more pronounced. Whereas we confirmed the dominance of N2 production by anammox (72% and 77%) at the two deepest sites (∼700 m of water), anammox was conspicuously absent from two shallower sites (∼200 m and 400 m). At the shallower sites, we could measure no anammox activity with either intact or homogeneous sediment, and quantitative PCR (16S rRNA) gave a negligible abundance of anammox bacteria in the anoxic layers. Such an absence of anammox, especially at one locale where it was originally demonstrated, is hard to reconcile. Despite the dominance of anammox at the deepest sites, anammox activity could not make up for the drop in denitrification, and assuming Redfield ratios for the organic matter being mineralized, the estimated retention of fixed N actually increased to 90% to 97% of that mineralized, whereas it was 80% to 86% at the shallower sites.
INTRODUCTION
Anaerobic ammonium oxidation (anammox) is the bacterially mediated oxidation of ammonium to N2 gas at the expense of nitrite and represents an additional sink for fixed nitrogen in the biosphere, besides denitrification (1, 2). Whereas geochemical profiles had suggested the presence of an anammox-like reaction in the environment for nearly 50 years, it was confirmed experimentally using 15N-labeled compounds only a little over 10 years ago (3, 4). Since then its activity and affiliated bacteria have been documented in a wide variety of deep marine, coastal, and estuarine sediments, and simply documenting anammox in the environment is no longer novel (5–7). Some seasonal studies, however, have shown anammox activity to be either ephemeral or absent in some estuarine and marsh sediments, and its true regulatory mechanisms remain to be resolved (8–11).
Most of what we know about anammox in sediments has, however, been concluded from experiments using homogenized anoxic sediments, which, by destroying sediment structure and redox gradients, cannot capture its true in situ characteristics (12, 13). Further, accounts of anammox in sediments from waters deeper than 150 m are still scarce (14–17). As the majority (∼61%) of the total benthic mineralization of organic matter in the ocean is thought to occur in sediments beyond 200 m of water, there is a need to better understand carbon and nitrogen cycling in such sediments using intact sediment cores which, by preserving structure and redox gradients, get closer to capturing true in situ activity (18). Simultaneous estimation of the in situ activities of anammox and denitrification in intact sediment cores has been made possible by an extension of the isotope-pairing technique, which was originally developed for and has been widely used to determine benthic denitrification rates (13, 19).
A recent review confirmed a strong linear increase in the relative contribution from anammox (ra) to total N2 production with water depth, largely in line with previous observations (5), but only up to about 50% at 150 m; after that, and with the inclusion of sediment in 1,000 m to 3,000 m of water, the trend plateaus and an ra of over 50% appear to be rare (7). The observed initial increase in ra with water depth may, in part, be explained by a general decline in the availability of organic carbon and/or sediment reactivity with water depth, but it cannot explain all of the data (3, 18, 20).
For example, in the sediments of the deep Norwegian Trench in the Skagerrak, anammox has been shown to account for up to 79% of total N2 production (ra) in 700 m of water, declining to 24% by 380 m (3, 20). Such a high ra in the deep Skagerrak appears to be atypical and may be more related to the specific biogeochemistry of that locale, rather than a simple lack of organic carbon at that depth. For example, 90% of carbon mineralization in the deepest part of Skagerrak is driven by the reduction of Mn oxide, rather than a more even split between oxygen and sulfate reduction (21, 22).
In general, it might be expected that anammox would contribute at least 50% of total N2 production in sediments beyond 200 m water depth (3), but there are few data to support this hypothesis. Further, it has been suggested that the presence of anammox in sediments increases the efficiency by which fixed, bioavailable N is removed by conversion to N2, i.e., that a larger fraction of the N that enters the sediment in organic matter is lost as N2 at such sites relative to locations where denitrification is the only or dominant sink for fixed N (e.g., see reference 3). Thus, locations with high ra could be particularly important for the removal of fixed N, but direct evidence for this is lacking. This is a central issue for understanding the role of anammox in the marine N cycle.
To improve our understanding of the N cycle, we returned to the depth transect in the Skagerrak where anammox activity was first measured (3). We measured anammox and denitrification activity under conditions more representative of those in situ using intact sediment cores, together with oxygen penetration and consumption, with the latter being used as a direct proxy for the bioavailability of organic carbon at each site (13, 18). We also made confirmatory measurements of anammox activity in homogenized sediment and estimated the abundance of anammox bacteria using quantitative PCR (qPCR). We tested whether or not the relationship between depth and the significance of anammox also held for intact sediments and whether or not the ratio of organic N mineralized to that removed as N2 gas varied along this depth transect.
MATERIALS AND METHODS
Sediment sampling.
In June 2010, sediment was collected from the deepest part of the central Skagerrak (688 m, site S9) and then along a depth gradient southwards to 176 m (site S4) (Table 1 and Fig. 1). These sites have been studied extensively and are the same as those evaluated in the studies described in references 3 and 21. The MnO2 content of the top 2 cm of sediment at the deepest site is extremely high, at up to 300 μmol g−1 sediment (dry weight), whereas it is 10 μmol g−1 sediment (dry weight) in other coastal areas (20, 21).
Table 1.
Locations of sites ranked by depth, along with temperature, salinity, and oxygen concentrations in the water column collected with the CTD at 5 m above the seabeda
| Site | Position | Depth (m) | Temp (°C) | Salinity (ppt) | O2 (%) | Concnb (μM) |
||||
|---|---|---|---|---|---|---|---|---|---|---|
| O2 | NH4+ | NO3− | NO2− | HPO42− | ||||||
| S4 | 57°59.02N, 9°38.77E | 176 | 6.9 | 35 | 86 | 260 | 0.90 | 10 ± 0.25 | 0.39 ± 0.01 | 0.71 ± 0.02 |
| S6 | 58°02.90N, 9°34.81E | 384 | 5.8 | 35 | 85 | 264 | 0.53 ± 0.09 | 10 ± 0.13 | 0.05 ± 0.002 | 0.73 ± 0.05 |
| S8 | 58°10.56N, 9°31.90E | 610 | 4.5 | 35 | 86 | 276 | 0.67 ± 0.3 | 7.6 ± 0.5 | 0.05 ± 0.01 | 0.71 ± 0.03 |
| S9 | 58°14.10N, 9°32.12E | 688 | 4.5 | 35 | 86 | 274 | 0.52 ± 0.33 | 8.1 ± 0.011 | 0.03 ± 0.01 | 0.67 ± 0.04 |
Note that at site S8, nutrient concentrations were measured separately in the overlying water of the sediment cores collected in the box corer (n = 7).
Data represent means ± standard errors (n = 3).
Fig 1.
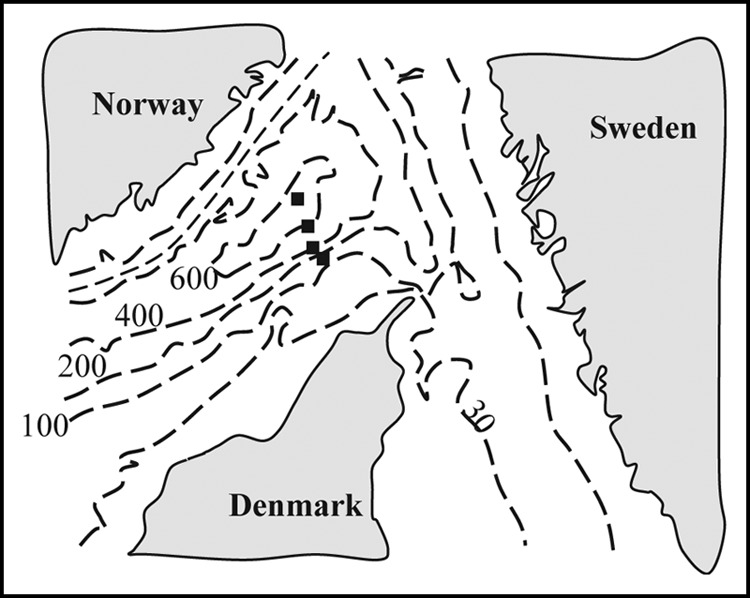
Schematic map over the Skagerrak. The major depth contours are given (100 m) along with the approximate locations of the four sites (filled squares) in order from the top: sites S9, S8, S6, and S4. The exact locations are presented in Table 1. Note that the site names are the same as those presented elsewhere (3, 21).
First, sediments were collected using an Olausen box corer (∼0.09 m2 by 0.8 m deep), and then, if the sediment-water interface was still visibly intact and the overlying water was clear, subsampled using Perspex core liners. The subsample core liners were 15 cm long by 8.8 cm for oxygen profiles (n = 6), 50 cm long by 8.8 cm for oxygen uptake (n = 4), and 30 cm long by 5.7 cm for 15N2 production (n = 26). Each core liner was filled with sediment to approximately three-quarters of its overall length. All of the subsampled cores were stored on board in a temperature-controlled (7°C) room, where all of the subsequent experimental manipulations were also carried out. A conductivity, temperature, and depth (CTD) cast provided standard Seabird/General Oceanics electronic data for depth, temperature, salinity, and oxygen saturation at each site. Bottom water was also collected from 5 m above the seabed for topping up the sediment cores. Nutrient (NH4+, NO2−, NO3−, and HPO42−) concentrations were measured in the bottom water using standard wet chemistries and a segmented flow autoanalyzer (23). The sediment manganese content was analyzed by dithionite-citrate-acetic acid extraction with quantification by atomic absorption spectroscopy (24).
Penetration and consumption of oxygen.
Each of the six short sediment cores (15 cm long by 8.8 cm) was placed, in turn, inside a small Perspex aquarium (15 cm by 15 cm by 20 cm) with aerated bottom water. The concentration of dissolved oxygen in the sediment was then measured at a resolution of 100 to 200 μm (depending on the overall depth of penetration), using a 50-μm oxygen sensor (OX50; Unisense AS, Denmark) attached to an automated micromanipulator controlled by microprofiling software (SensorTrace PRO; Unisense). The four longer sediment cores (50 cm long by 8.8 cm) were completely topped up with bottom water and then fitted with a cap equipped with a small rotating (400 rpm) magnetic flea and a cable gland for holding an oxygen electrode (25). The oxygen concentration in the water overlying the sediment was logged at 5-min intervals using oxygen electrodes (OX50; Unisense AS, Denmark) connected to in-line amplifiers and a four-channel data-logging meter (UnderWater meter; Unisense). Rates of oxygen consumption were calculated using linear regression through oxygen versus time, in combination with the water volume and sediment area for each core.
Measuring anammox and denitrification activity in intact sediment cores using 15NO3−.
Rates of anammox and denitrification were measured as described in reference 17. The last set of sediment cores (30 cm long by 5.7 cm) were topped up with bottom water, and each core was then fitted with a small Teflon-coated stirrer bar to gently mix the water (30 rpm) throughout the 15N experiment. Oxygen was kept at air saturation by gentle bubbling of the water column in each core with air, and the oxygen saturation was periodically checked with the oxygen sensors. Successful application of the isotope-pairing technique (IPT) or its revised version (r-IPT) requires that the 15NO3− applied to the overlying water be at steady state with the 14NO3− in the nitrate reduction zone (19). Preincubation times were calculated using the parallel measurements of oxygen penetration, along with temperature, porosity, and the diffusivity of NO3− (see Table S1 in the supplemental material).
Batches of six sediment cores had 15NO3− (99.3 15N atom%; Sigma-Aldrich) added to the overlying water to generate a concentration series of 10, 30, 40, and 50 μM 15NO3− (n = 24). The cores were then preincubated for the appropriate length of time (as described above). Samples of overlying water (10 ml) were collected from each core before and after the addition of 15NO3−, in order to determine the ratio of 14NO3− and 15NO3− in the overlying water (r14w) and the concentration of other inorganic nutrients (NH4+, NO2−, and HPO42−). At the end of the preincubations, one core from each batch with each 15NO3− concentration was sacrificed to function as a time zero measurement. The rest of the cores were sealed with a rubber bung and left to incubate (n = 20). To stop the incubation, ZnCl2 (1 ml, 7 M) was added to the overlying water in each core, before the sediment was gently mixed with the overlying water. A sample of this slurry was then gently transferred to a gas-tight vial (12-ml Exetainer; Labco) and preserved with 0.1 ml 37% formaldehyde. The remaining cores were left to continue incubating (7 h for the sample from site S4, 10 h for the sample from site S6, and 20 h for the samples from sites S8 and S9) until the oxygen in the overlying water had decreased by a maximum of 20%, when the incubations were then stopped and the cores were treated as described above. Two cores were left unamended to serve as references for the natural abundance of 15N2 and 15N2O.
Anammox and denitrification measured in anoxic homogenized sediment.
The oxygen profiles were used to delineate the oxic and anoxic sediment layers (Fig. 2). Three sediment cores were then extruded, the oxic layers were removed, and a 2-cm-thick slice of anoxic sediment was collected from each core, which was then homogenized. The homogenized sample was then transferred to a portable anoxic glove box constantly flushed with oxygen-free nitrogen (Belle Technologies). Then, ∼2 cm−3 of sediment was aliquoted into 30 gas-tight vials (6 ml; Exetainer; Labco), each holding a few glass beads, and the vials were sealed. The vials were then preincubated for at least 12 h to remove all residual O2, NO3−, and NO2− (26).
Fig 2.

Oxygen penetration into the sediment and abundance of anammox bacteria. (a) The two shallower sites, where anammox activity was absent; (b) the two deeper sites, where we measured significant anammox activity. Data points (mean, n = 6) for oxygen have been replaced by simple lines for clarity, and abundance was based on a single determination. The two horizontal bars in panel b depict the potentially greater penetration of oxygen if the measurements had been made in situ on the seabed (see Results and reference 18).
After preincubation, 15N isotopes were added by injecting 100 μl of a 1 mM deoxygenated solution of either 15NH4+, 15NO3−, or 15NH4+ plus 14NO3− (n = 3 for each treatment and at each time point) through the vial septa to give a final concentration of approximately 50 nmol 15N cm−3 of wet sediment (3, 20). The vials were then shaken vigorously by hand and incubated at 7°C. In the 15NO3− treatment, production of 15N2 was measured at five time points over 15 h by inhibiting the activity in batches (n = 3) of sediment once every 3 h. For the incubations with 15NH4+ and 15NH4+ plus 14NO3− combined, measurements were made only at time zero and the final time, as the latter combination of isotopes was merely used to confirm the presence of the anammox reaction. Incubation was stopped by injecting ZnCl2 (100 μl, 7 M) through the vial septa in each case. After 15N analysis of the headspace (see “15N gas analyses and rates of anammox and denitrification” below) the vials were opened and the wet and dry weights of sediment were determined.
Abundance of anammox bacteria by qPCR.
One of the sediment cores used to measure oxygen consumption was subsequently sectioned at 0.5-cm intervals between 0 cm and 3 cm and 1-cm intervals at between 3 cm and 5 cm, and the sediment was homogenized and stored frozen (−80°C) for later extraction of DNA. Back in the home laboratory, DNA was extracted using a Power Soil DNA extraction kit (MoBio Laboratories) and known standards.
Detection of the 16S rRNA genes of anammox bacteria was performed with the TaqMan assay with primers 541FRT (5′-GAG CAC GTA GGT GGG TTT GTA AG-3′) and 616RRT (5′-CCT CCT ACA CTC AAG ACT YGC AG-3′). Primer 541FRT was based on previously described primer Brod541F, which has been found to be 100% specific for anammox bacterium 16S rRNA genes from several environments (27). Primers Brod541F and Brod1260R have been used to characterize the distribution of anammox bacteria in marine and freshwater sediments (27). Primer 541FRT, which is based on primer Brod541F, was obtained using alignments of 475 16S rRNA gene sequences obtained with primers Brod541F and Brod1260R, as well as environmental clones related to anammox bacteria from GenBank, to confirm primer and probe complementary regions where the use of degenerative bases was necessary (C. R. Penton, P. Engström, A. H. Devol, and J. M. Tiedje, unpublished data from qPCR of anaerobic ammonium-oxidizing bacteria in deep Pacific Ocean sediments of the Cascadia Basin). The primers and probe were verified against sequences in GenBank for specificity: primers 540FRT, 616RRT, and AnPrb, respectively, showed one, two, and three mismatches against “Candidatus Scalindua wagneri” (GenBank accession no. AY254882); none, none, and two (due to extra A residues in the GenBank 16S rRNA sequence, possibly due to extra base calls) mismatches with “Candidatus Scalindua brodae” (GenBank accession no. AY254883), and two, zero, and zero mismatches with “Candidatus Scalindua sorokinii” (GenBank accession no. AY257181); all three primers generally showed zero mismatches with the 475 clones from a previous study (27).
Quantitative PCRs and optimizations were performed as described in the Applied Biosystems protocol for TaqMan assays with annealing and extension temperatures of 60°C. Final assay concentrations of primers 541FRT, 616RRT, and AnPrb were 300 nM, 300 nM, and 250 nM, respectively, and 2 μl of sample resulting from the DNA extraction was added to each well. The increase in fluorescence emission was monitored during PCR amplification using a 7300 real-time PCR system (Applied Biosystems). The 16S rRNA gene copy number of the anammox bacteria was determined from a standard curve using an anammox bacterium 16S rRNA-containing clone with 99% nucleotide identity to the characterized anammox bacterium “Candidatus Scalindua wagneri” (primers Brod541F/Brod1260R). The estimate of anammox bacteria from the standard curve assumed that any anammox bacteria detected held only one copy of the 16S rRNA gene per cell, as in “Candidatus Kuenenia stuttgartiensis” (28) and the metagenome of Candidatus “Scalindua profunda” (29).
Standard curves in the qPCR runs were linear (r2 = 0.99) with 5 standards covering 8.05 × 10⁶ to 8.05 × 10² plus one blank (Milli-Q water). The values for all blanks lay below the limit of detection (threshold cycle [CT] value > 39) and were not included in the standard curve. The detection limit of anammox bacteria was set to the lowest standard (805 copies of anammox bacteria μl−1 sample), with CT equal to 38. A rough estimate of the total bacterial abundance was given by measuring the extracted DNA on a NanoDrop spectrophotometer measuring the absorbance at 260 nm. The DNA concentration measured on the NanoDrop spectrophotometer was then converted to the number of genomes g−1 sediment using the conversion of 980 Mbp pg−1 DNA and an average genome size of 4.3 Mbp.
15N gas analyses and rates of anammox and denitrification.
A headspace of analytical-grade helium (1 ml) was introduced into the vials from the sediment core experiments and allowed to equilibrate. The headspace was then analyzed for 15N2 and 15N2O using continuous-flow isotope ratio mass spectrometry (17). The N2 already present in the headspace of the vials for the homogenized sediment experiments was analyzed directly. The concentration of both 15N gas species was calculated as the excess over the natural abundance (30).
The total ambient production of N2 gas (p14 as N) in either the intact cores or homogenized sediment was calculated using the revised formulation of the isotope-pairing technique (12):
| (1) |
where r14 is the ratio of 14NOx− to 15NOx− in the nitrate reduction zone and p29N2 and p30N2 are the measured amounts of 15N-labeled N2 produced during the incubations. The production of N2 gas due to anammox was calculated as
| (2) |
Denitrification is the difference between equations 1 and 2. For the intact sediment cores, r14 was estimated from the distribution of 15N produced in the N2O pool (13):
| (3) |
where p45N2O and p46N2O are the measured amounts of 15N-labeled N2O produced during the incubations. For the homogenized sediments, r14 is simply equivalent to the 15N atom% of the 15NO3− used in the assay, which was typically 99.2% (3).
Statistical analyses.
Statistical analyses were performed using SPSS software, v. 13.0. Analysis of variance (ANOVA) with pairwise comparisons was used to test for a difference in the production of 29N2 in the anoxic homogenized sediments from that of 15NH4+ with and without 14NO3− and between the ratio of the amounts of 14N to 15N (r14) in the N2 and N2O produced in the sediment cores across all four sites. Estimates of the production of 15N2 or consumption of oxygen, for example, were derived using linear regression. Other relationships in the data were explored using Pearson's correlation, where appropriate.
RESULTS
Site, sediment, and water column characteristics.
The positions and water depths for all sites are shown in Table 1. The temperature of the bottom water varied from 4.5°C at the deepest site to 6.9°C at the shallowest site, while salinity and oxygen saturation were consistent across all sites (Table 1). Except for ammonium and nitrite, which were present in the largest amounts in the bottom water at the shallowest site, all the other measures of inorganic nutrients were of a similar magnitude across all four sites (Table 1). The average sediment porosity for the top 0 to 4 cm increased from 0.61 at site S4 to 0.80 at site S6 and 0.87 at both sites S8 and S9. The manganese content increased abruptly from 1.5 and 2.5 μmol g−1 sediment (dry weight) at sites S4 and S6, respectively, to 270 and 421 μmol g−1 sediment (dry weight) at sites S8 and S9, respectively. The manganese oxide zone was clearly evident as a chocolate brown layer at sites S8 and S9, whereas the surface sediment at sites S4 and S6 was olive brown, indicating the presence of iron oxides and, hence, no accumulation of free sulfide from 5 to 10 cm depth, where a blackening of the sediment occurred (31). Consistent with this, no smell of sulfide was noted when the surface sediment was sectioned.
Penetration of oxygen and abundance of anammox bacteria.
The overall shape of the oxygen profiles and depth of penetration for oxygen into the sediment were typical for these sites (Fig. 2). The profiles were smooth, which suggested no active bioirrigation at any of the sites at the time of sampling. Penetration increased with water depth from approximately 0.7 cm at 176 m to 1.5 cm at 688 m, though the deepest penetration, of 2.4 cm, was measured at 610 m. We also adjusted the maximum depth of penetration at the two deepest sites to estimate the effect of shipboard measurements relative to in situ profiles (18). Accordingly, this increased penetration further at 610 m and 688 m to 2.8 cm and 1.8 cm, respectively (horizontal bars in Fig. 2b).
The abundance of anammox bacteria varied greatly among the four sites (Fig. 2; see Table S3 in the supplemental material) and varied the most markedly at site S4, where the abundance was negligible, except in the top 0.5 cm of sediment (Fig. 2a). At site S6, only the layers between 1.5 and 3 cm had abundances over the detection limit (CT value = 38). In contrast, evidence that anammox bacteria made up a significant fraction of the total bacterial community, especially in the anoxic sediment layers, was much stronger at the deeper sites (Fig. 2b). Here, the average abundance of anammox bacteria was 23 to 34 times higher than that at sites S4 and S6 (top 0 to 5 cm of sediment; see Table S3 in the supplemental material). The total bacterial abundance varied from 5.6 × 10⁸ to 1.7 × 10⁹ cells g−1 sediment (wet weight) (see Table S3 in the supplemental material), which is in line with other reports of bacterial abundance in marine sediments (32, 33).
Anammox and denitrification activity in anoxic homogenized sediment.
We measured no significant production of 29N2 in the sole presence of 15NH4+ at any of the four sites (Table 2). Hence, there was no evidence for anaerobic ammonium oxidation coupled to the reduction of MnO2 (or Fe oxides), despite the very high concentration of MnO2 at the two deepest sites, confirming previous data for Skagerrak (30). In contrast, we measured very strong production of 29N2 with both 15NH4+ and 14NO3− at sites S9 and S8, which confirmed the potential for the anammox reaction at these two sites, whereas the anammox reaction was absent at sites S6 and S4 on this occasion. Similarly, with the addition of 15NO3−, we measured the production of 29N2 at sites S9 and S8 (data not shown), with the overall rates of anammox being similar to the raw rates of 29N2 production with 15NH4+ and 14NO3− (Table 2). Again, we could not measure any significant anammox potential over time with 15NO3− at sites S6 and S4. In contrast, we measured significant production (P < 0.001) of 30N2 over time with 15NO3− at all sites, with the potential for denitrification being some 1 to 2 orders of magnitude greater at sites S6 and S4 (Table 2). The spike of 15NO3− (∼50 nmol 15N cm−3 wet sediment) had been completely exhausted at between 2 h and 5 h at the most reactive sites (sites S4 and S6; data not shown), and only approximately 40% of the 15NO3− was recovered as 15N2 gas. In contrast, at the far less reactive sites, sites S8 and S9, up to 82% of the 15NO3− was recovered as gas after 19 h, and production was ongoing. Finally, anammox dominated the production of N2 at the two deepest sites, with an ra of approximately 70% at sites S9 and S8.
Table 2.
Data obtained using anoxic homogenized slurries of sediment collected at each sitea
| Site | Amt produced (nmol N g−1 sediment [wet wt] h−1) |
ra (%) | |||
|---|---|---|---|---|---|
|
29N2b |
15NO3−c |
||||
| 15NH4+ | 15NH4+ + 14NO3− | Anammox | Denitrification | ||
| S4 | 0 (0.743) | 0 (0.892) | 0 (0.638*) | 12.18 ± 1.57 (<0.001*) | 0 |
| S6 | 0 (0.955) | 0 (0.893) | 0 (0.957) | 3.62 ± 0.24 (0.041) | 0 |
| S8 | 0 (0.139) | 1.57 ± 0.13 (<0.001) | 1.43 ± 0.18 (0.016) | 0.63 ± 0.13 (0.037) | 69 |
| S9 | 0 (0.361) | 0.88 ± 0.12 (<0.001) | 0.76 ± 0.09 (0.004) | 0.33 ± 0.08 (0.029) | 70 |
First, the potential for the anammox reaction was confirmed by the positive production of 29N2 with 15NH4+ and 14NO3− relative to that of 15NH4+ on its own, and second, the rate potential for anammox and denitrification was estimated after the addition of 15NO3−. Finally, the relative contribution from anammox to the total production of N2 gas (percent ra) is also given. All production values are given as means ± standard errors (n = 3).
P values (given in parentheses) are for the difference in nmol 29N2 (as N) g−1 sediment (wet weight) between time zero and the final time point across treatments (2-way ANOVA pairwise comparisons).
P values (given in parentheses) are for the regression through production with time. *, the 15NO3− had been exhausted by the first time point and production was estimated between time zero and the first time point only (as described in footnote b).
Anammox, denitrification, and oxygen consumption in intact sediment cores.
The ratio of 14N to 15N in the N2 and N2O produced in the sediment cores was markedly different between the deep and shallow sites (see Table S2 in the supplemental material). The isotopic composition of N2 and N2O differed significantly only at sites S9 and S8, suggesting significant dilution of the 15N in N2 with 14N from 14NH4+ through anammox activity, relative to that of the N2O produced solely by denitrification. The ratio of 14N to 15N was the same in both gases produced at sites S6 and S4, which, in very good agreement with the results from anoxic homogenized sediments, also suggested no anammox activity at the two shallower sites. The comparative effect of either anammox activity or its absence on the distribution of 14N and 15N in the gases produced at the different sites is illustrated in Fig. 3.
Fig 3.
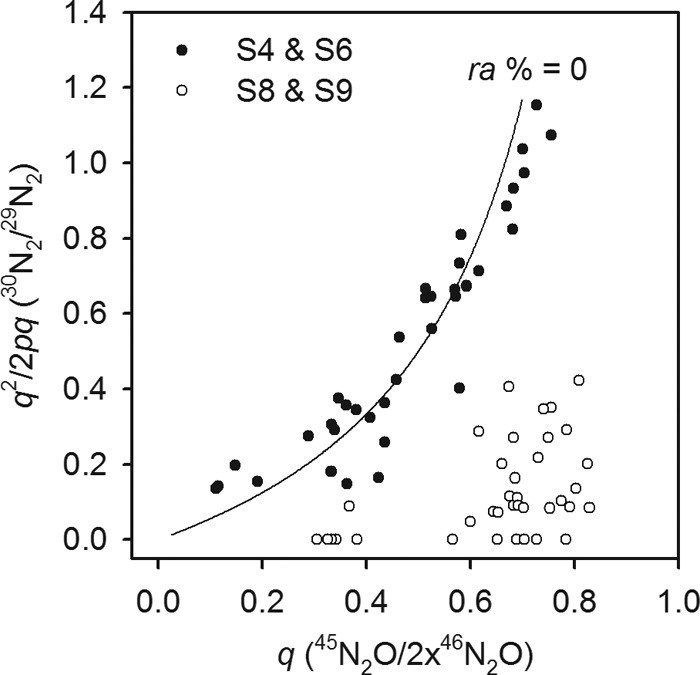
Effect of anammox on the relative distribution of 15N between the N2 and N2O gases produced in the incubations. Here, the q on the x axis is the proportion of 15N relative to that of 14N (p) in the N2O pool, which can come only from denitrification, and provides a direct measure of the ratio of 14NO3− to 15NO3− undergoing reduction. The y axis (q2/2pq) is the ratio of 30N2 to 29N2 produced in the N2 pool, and the curved line is the theoretical distribution of 14N and 15N (q2/2pq) as a function of q in the absence of anammox (ra = 0%). Anammox was clearly absent at the two shallow sites, sites S4 and S6.
The maximum consumption of oxygen by the sediment was measured at the shallowest site, with activity decaying thereafter with greater water depth (Table 3; Fig. 4). The pattern of oxygen consumption agreed very well with the profile measurements; i.e., as consumption dropped with depth, penetration increased. We took these together to be a direct measure of a general decline in bioavailable carbon along our depth transect. However, although the rate of total N2 gas production also decreased with increasing water depth, as for oxygen consumption (r = 0.99 and r = 0.94, respectively), it exhibited a stronger attenuation with depth than did the rate of oxygen consumption. For example, at the two shallowest sites, the ratio of total N2 gas production to oxygen consumption was 0.02 to 0.03, but it was only 0.005 to 0.015 at the deepest sites (Table 3). There was also no smooth transition in the contribution from anammox to the production of N2 gas with depth, with a complete lack of anammox activity at the two shallowest sites and a dominance of N2 production at the two deepest sites (ra = 77% and ra = 72%, respectively). Further, at the two deepest sites, the ratio of denitrification alone to oxygen consumption was only 0.001 to 0.003, whereas it was greater than 0.02 at the two shallowest sites.
Table 3.
Process rates measured in intact sediment cores at the four sites ordered by deptha
| Site | Depth (m) | Amt produced (μmol O2 or N m−2 h−1) |
Ratio of the following to oxygen uptake: |
% N conservedf | ra (%) | |||||
|---|---|---|---|---|---|---|---|---|---|---|
| Oxygen uptake | Denitrification | Anammox | T-N-N2b | Organic N mineralizedc | D-N-N2d | T-N-N2e | ||||
| S4 | 176 | 612 ± 108 | 13.25 ± 1.3 | 0 | 13.25 | 93 | 0.022 | 0.022 | 86 | 0 |
| S6 | 384 | 319 ± 57 | 9.57 ± 2.3 | 0 | 9.57 | 48 | 0.030 | 0.030 | 80 | 0 |
| S8 | 610 | 178 ± 19 | 0.61 ± 0.1 | 2.01 ± 0.3 | 2.62 | 27 | 0.003 | 0.015 | 90 | 77 |
| S9 | 688 | 210 ± 18 | 0.30 ± 0.2 | 0.77 ± 0.2 | 1.07 | 32 | 0.001 | 0.005 | 97 | 72 |
We also estimated the rate of organic N mineralized and the percentage of that N conserved as fixed N, with the remainder being lost as N-N2 gas. The contribution from anammox to the total production of N2 gas (ra) and the molar ratio of N-N2 produced per mole of oxygen consumed, i.e., the number of moles of total organic N mineralized, are also given. Values are means ± standard errors (n = 20 for anammox and denitrification, n = 4 for oxygen uptake).
T-N-N2, total rate of N2 production due to denitrification and anammox (where applicable).
Organic N mineralized, oxygen uptake/Redfield ratio for a C-to-N ratio of 6.6.
Calculated using the rate of N2 production just due to denitrification (D-N-N2).
Calculated using the total rate of N2 production (T-N-N2).
The amount of N conserved as fixed N = 100 − [(T-N-N2/organic N mineralized) × 100], where T-N-N2 and organic N mineralized are as defined in footnotes e and c, respectively.
Fig 4.
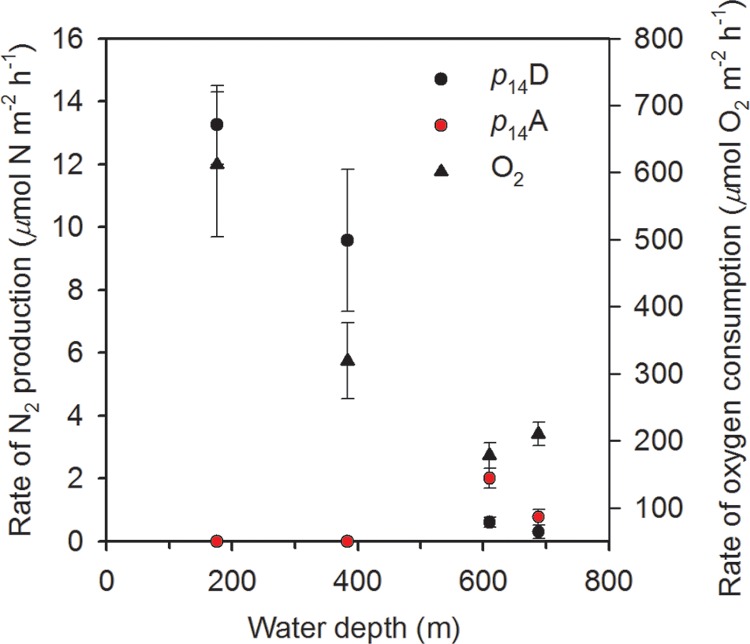
Overall summary of the measured rates of activity in intact sediment cores as a function of water depth. The ambient production of N2 is given for both anammox (p14A) and denitrification (p14D) along with the consumption of oxygen by the sediment at the four sites. Values are means ± SEs (n = 20 for N-N2 gas and n = 4 for O2).
DISCUSSION
Although the anammox reaction and its affiliated bacteria have now been reported across a spectrum of estuarine, coastal, and deep-water sediments (5, 6, 16, 26), some sediments have proven negative for anammox (9, 26, 34, 35). To date, however, any negative accounts in the literature have been confined to studies of the reaction in shallow coastal embayments and/or an estuary proper. For coastal and deeper marine sediments, the anammox reaction and affiliated bacteria appear to be widespread, and we are not aware of any other accounts of such sediments proving negative for both. Our negative results, especially where anammox activity had previously been measured (site S6), were surprising and in stark contrast to the results reported in the literature to date (3, 7).
Previous accounts of anammox at site S6 recorded potential activity of approximately 3 to 5 nmol N cm−3 h−1, alongside denitrification of 5 to 15 nmol N cm−3 h−1 (3, 36). Although our denitrification potential measured at site S6 (∼4 nmol N cm−3 h−1) was at the lower end of the published range, the assay is more than capable of resolving even lower potentials. For example, our potentials for denitrification and anammox measured at site S9 (∼0.3 and 0.8 nmol N cm−3 h−1, respectively) were clearly significant (mean ≠ 0) and in good agreement with the original accounts of the two processes at this site (∼0.2 to 3 nmol N cm−3 h−1 and 0.6 to 1.8 nmol N cm−3 h−1 for denitrification and anammox, respectively), and the activity at site S8 was similar to that at site S9. Natural sediment heterogeneity at any one site can explain the range of measured potentials reported here (and elsewhere), but it is unlikely to account for the complete absence of anammox at site S6 on this occasion. For example, the anammox and denitrification activities at both sites S9 and S6 are highly positively correlated with each other (r = 0.98 and n = 18 for the data in reference 3), and, as such, having been able to measure denitrification at site S6, we would have expected a proportionate and detectable amount of anammox. The time course incubation clearly showed that all of the 15NO3− had been consumed in the homogenized anoxic sediments at sites S4 and S6, and an extended incubation time would have done nothing to improve the sensitivity of the anammox assay. There are no published accounts of anammox at site S4, but the trends at this site also fall outside the general trends observed previously in the Skagerrak, where potential anammox activity of 1.6 nmol cm−3 h−1 and an ra of 15% were determined at a site 90 m deep (3, 36).
Since its development and publication in 2006, the combined 15N2O and 15N2 technique (r-IPT) for estimating in situ rates of anammox and denitrification in intact sediment cores has now been applied across a broad range of marine sediments (from those on coastal shelves to those in the deep sea), with various contributions from anammox to the production of N2 gas being found (13, 17, 37). Adding the data collected here to those already published revealed a very good agreement between the contribution of anammox to the production of N2 estimated with anoxic homogenized sediments and that captured by the combined 15N2O and 15N2 r-IPT in intact sediment cores (Fig. 5). The slight curvature in the data may indicate that in sediments that support only moderate contributions from anammox, competition for NO2− is most intense and the use of homogenized sediment underestimates the significance of anammox (ra) relative to the use of intact sediment cores, where anammox bacteria compete with fewer of the facultative denitrifiers (13, 38). Once conditions become more favorable for anammox bacteria, such competition is less intense (even absent) and the two techniques agree more closely (36).
Fig 5.
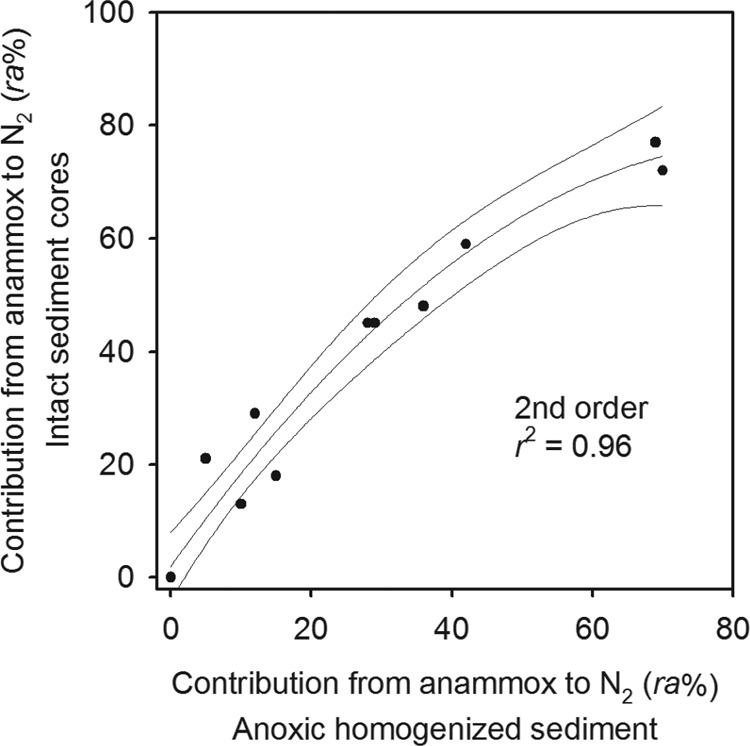
Comparison of available estimates for the contribution of anammox to the production of N2 gas (percent ra) measured in intact sediment cores (15N2 and 15N2O; r-IPT) and parallel measurements in anoxic homogenized sediment. Data are from the deep North Atlantic and the Irish Sea (17), the North Sea (37), the Thames and Medway estuaries (13), and the current study. The data have been fitted with a 2nd-order polynomial, which explained more of the variance than a linear 1st-order regression (r2 = 0.96 and r2 = 0.93, respectively). Note that the slope for the 1st-order regression was 1.06.
We purposely did not measure sediment bulk organic content but used the drop in both oxygen consumption and N2 production as more sensitive measures of the steady decline in bioavailable organic matter with increasing water depth (18, 39). The rates of oxygen consumption were in the normal range for depths of 200 m to 400 m and similar to previous values from these sites (18, 21, 22). Importantly, nothing indicated a step change in bioavailable carbon on either side of the 400-m water depth, i.e., a change that may swap sediment that supports denitrification to sediment that supports anammox (Fig. 4) (3, 20). Anammox requires both NO2− and NH4+, both of which are ultimately derived from heterotrophic pathways, and therefore, anammox cannot operate independently from the mineralization of organic matter (40). Indeed, a gradual increase in ra was previously observed with a decrease in the reactivity of the organic matter (20). Inhibition by sulfide is also not a likely explanation for the absence of anammox at the two shallowest sites (sites S4 and S6). While we did not measure sulfide in the pore water, the color and smell of the surface sediment indicated that pore waters were not sulfidic, in agreement with previous observations (21); and also, the oxygen consumption rates at sites S4 and S6 were low relative to those in sulfidic sediments underlying fully oxic bottom water (41, 42), but we cannot fully rule out the possibility that sulfide levels were high prior to our visit.
On average, only 40% of the 15NO3− was recovered as gas in the incubations with anoxic homogenized sediment at sites S4 and S6, which may be indicative of significant potential for the dissimilatory reduction of nitrate to ammonium (DNRA) in these more reactive sediments. Similar patterns have been observed in estuarine sediments, where the inferred higher potential for DNRA actually favored the anammox pathway (43). In contrast, in tropical estuaries, directly measured DNRA has been found to totally dominate nitrate reduction to the almost complete exclusion of denitrification and anammox (35). Given that we measured denitrification in the intact sediment cores at sites S4 and S6 at rates comparable to those measured in other shelf sediments at these depths (13 μmol N m−2 h−1 [15]), we conclude that DNRA was not responsible for the absence of anammox at these two sites. The greater recovery of 15NO3− as gas at sites S8 and S9 was in agreement with previous direct measurements of only moderate (<10%) DNRA potential at the deeper sites (36).
We can only tentatively suggest that the absence of anammox at sites S4 and S6 might be due to some event that not only inhibited anammox activity but also essentially removed the affiliated bacteria from the sediment. Even if our qPCR underestimated anammox bacterial cell numbers (44), the difference between our deep and shallow sites was stark. The sediments at sites S4 and S6 are known to be trawled (those at sites S8 and S9 are not), which, by regularly disturbing and reoxidizing the top 5 cm to 10 cm, may have favored the faster-growing denitrifiers over anammox bacteria (45). No such negative effect of trawling on anammox has been measured in regions of the North Sea, however, where the density of trawling is well documented and particularly high (37). Similarly, some permeable sandy sediments, where frequent oscillations in redox state may favor the facultative denitrifiers over anammox bacteria, have proved negative for anammox activity (46, 47), but others have also proved positive (37). Why anammox activity appears to be intermittent or ephemeral at these sites remains to be resolved, but our findings clearly demonstrate that we are still a long way from being able to predict the final fate of N in the benthos from first principles, as has recently been suggested (48).
The only parameter other than anammox rates that changed greatly along our transect was the sediment manganese content, which was more than 100-fold higher at the deep sites. The dominance of N2 production by anammox at sites S8 and S9 may, as has been suggested before, actually be due to competition for organic substrates between denitrifying and manganese-reducing bacteria, the latter of which are known to dominate carbon mineralization at these sites (3, 24). Also, the availability of reduced iron and sulfur compounds as potential substrates for denitrification has previously been shown to be much lower at the manganese-rich sites due to inhibition of their production and to abiotic scavenging by manganese oxides below the nitrate zone (21, 49, 50). Such compounds have been suggested to be important for denitrification in marine sediments, and their absence may thus provide an additional explanation for the low denitrification rates (30).
The suppression of denitrification at the deep sites was evident from the very low ratios of denitrification to oxygen consumption of 0.001 to 0.003; in comparison, the ratios were 0.022 to 0.030 at the shallower sites. Indeed, and in stark contrast to the suggestion that high MnO2 stimulates the production of N2 gas (51) and despite the dominance of anammox (ra = 72% and 77%) at the two deepest sites, here the ratios of total N2 gas production to oxygen consumption were still very low (0.005 to 0.015). We then calculated that, if the organic matter being mineralized was of the Redfield ratio (6.6 C to 1 N), then with the measured rates of total N2 production and oxygen consumption, some 90% to 97% of the N mineralized would be conserved as fixed and bioavailable N that could be returned to the water column (Table 3). Our use of the Redfield ratio is supported by previous measurements of C and N mineralization rates in anoxic batch incubations from these sites, which yielded C-to-N mineralization ratios of 5.2 to 8.6 when ammonium adsorption was accounted for (20, 21, 30). Hence, in such marine sediments high in MnO2, large contributions from anammox to N2 production appear to be associated with an increased retention of fixed N, suggesting that such environments help to sustain primary production relative to sites where N2 flows mainly through denitrification. This assertion is critically dependent on the genuine C-to-N ratio of the organic matter being mineralized, but even if we use the C-to-N ratio of bulk organic matter in the deep Skagerrak of 9.9 (20), thus neglecting the likely preferential mineralization of nitrogen-rich compounds, we obtain a fixed N retention of 85 to 95% of the N mineralized, which still points to increased retention in the MnO2-rich sites and shows that the retention is certainly not lower at these sites than at those dominated by denitrification.
While the high manganese content likely explains the atypical dominance of anammox at sites S8 and S9, the lower manganese contents at sites S4 and S6 are normal for marine sediments and cannot explain the absence of anammox there. Hence, while some general trends are evident (7), we still have no real firm understanding of what regulates the dominance of one over the other in marine sediments (8). This study demonstrates, however, that the balance of the two processes may have important implications for the efficiency of fixed N removal in sediments and, hence, for marine nitrogen budgets.
Supplementary Material
ACKNOWLEDGMENTS
We thank the captain and crew of the R/V Skagerak and C. Ryan Penton, I. A. Sanders, and K. Dähnke for support with the qPCR, field work, and technical analyses.
We thank the Birger and Birgit Wåhlströms Fund and the Association of European Marine Biological Laboratories (ASSEMBLE) for support at The Lovén Centre for Marine Sciences at Tjärnö and Kristineberg, Sweden. B.T. was further supported by the Danish Research Council and the Danish National Research Foundation (DNRF53).
Footnotes
Published ahead of print 20 September 2013
Supplemental material for this article may be found at http://dx.doi.org/10.1128/AEM.01970-13.
REFERENCES
- 1.Mulder A, Vandegraaf AA, Robertson LA, Kuenen JG. 1995. Anaerobic ammonium oxidation discovered in a denitrifying fluidized-bed reactor. FEMS Microbiol. Ecol. 16:177–183 [Google Scholar]
- 2.van de Graaf AA, Mulder A, Debruijn P, Jetten MSM, Robertson LA, Kuenen JG. 1995. Anaerobic oxidation of ammonium is a biologically mediated process. Appl. Environ. Microbiol. 61:1246–1251 [DOI] [PMC free article] [PubMed] [Google Scholar]
- 3.Thamdrup B, Dalsgaard T. 2002. Production of N2 through anaerobic ammonium oxidation coupled to nitrate reduction in marine sediments. Appl. Environ. Microbiol. 68:1312–1318 [DOI] [PMC free article] [PubMed] [Google Scholar]
- 4.Richards FA, Cline JD, Broenkow WW, Atkinson LP. 1965. Some consequences of the decomposition of organic matter in Lake Nitinat, an anoxic fjord. Limnol. Oceanogr. 10:185–201 [Google Scholar]
- 5.Dalsgaard T, Thamdrup B, Canfield DE. 2005. Anaerobic ammonium oxidation (anammox) in the marine environment. Res. Microbiol. 156:457–464 [DOI] [PubMed] [Google Scholar]
- 6.Schmid MC, Risgaard-Petersen N, van de Vossenberg J, Kuypers MMM, Lavik G, Petersen J, Hulth S, Thamdrup B, Canfield D, Dalsgaard T, Rysgaard S, Sejr MK, Strous M, den Camp H, Jetten MSM. 2007. Anaerobic ammonium-oxidizing bacteria in marine environments: widespread occurrence but low diversity. Environ. Microbiol. 9:1476–1484 [DOI] [PubMed] [Google Scholar]
- 7.Trimmer M, Engström P. 2011. Distribution, activity, and ecology of anammox bacteria in aquatic environments. In Ward BB, Arp DJ, Klotz MG. (ed), Nitrification. American Society for Microbiology, Washington, DC [Google Scholar]
- 8.Babbin AR, Ward BB. 2013. Controls on nitrogen loss processes in Chesapeake Bay sediments. Environ. Sci. Technol. 47:4189–4196 [DOI] [PubMed] [Google Scholar]
- 9.Koop-Jakobsen K, Giblin AE. 2009. Anammox in tidal marsh sediments: the role of salinity, nitrogen loading, and marsh vegetation. Estuaries Coasts 32:238–245 [Google Scholar]
- 10.Risgaard-Petersen N, Meyer RL, Revsbech NP. 2005. Denitrification and anaerobic ammonium oxidation in sediments: effects of microphytobenthos and NO3−. Aquat. Microb. Ecol. 40:67–76 [Google Scholar]
- 11.Teixeira C, Magalhaes C, Joye SB, Bordalo AA. 2012. Potential rates and environmental controls of anaerobic ammonium oxidation in estuarine sediments. Aquat. Microb. Ecol. 66:23–32 [Google Scholar]
- 12.Risgaard-Petersen N, Nielsen LP, Rysgaard S, Dalsgaard T, Meyer RL. 2003. Application of the isotope pairing technique in sediments where anammox and denitrification coexist. Limnol. Oceanogr. Methods 1:63–73 [Google Scholar]
- 13.Trimmer M, Risgaard-Petersen N, Nicholls JC, Engstrom P. 2006. Direct measurement of anaerobic ammonium oxidation (anammox) and denitrification in intact sediment cores. Mar. Ecol. Prog. Ser. 326:37–47 [Google Scholar]
- 14.Engström P, Penton CR, Devol AH. 2009. Anaerobic ammonium oxidation in deep-sea sediments off the Washington margin. Limnol. Oceanogr. 54:1643–1652 [Google Scholar]
- 15.Gihring TM, Lavik G, Kuypers MMM, Kostka JE. 2010. Direct determination of nitrogen cycling rates and pathways in Arctic fjord sediments (Svalbard, Norway). Limnol. Oceanogr. 55:740–752 [Google Scholar]
- 16.Glud RN, Thamdrup B, Stahl H, Wenzhoefer F, Glud A, Nomaki H, Oguri K, Revsbech NP, Kitazato H. 2009. Nitrogen cycling in a deep ocean margin sediment (Sagami Bay, Japan). Limnol. Oceanogr. 54:723–734 [Google Scholar]
- 17.Trimmer M, Nicholls JC. 2009. Production of nitrogen gas via anammox and denitrification in intact sediment cores along a continental shelf to slope transect in the North Atlantic. Limnol. Oceanogr. 54:577–589 [Google Scholar]
- 18.Glud RN. 2008. Oxygen dynamics of marine sediments. Mar. Biol. Res. 4:243–289 [Google Scholar]
- 19.Nielsen LP. 1992. Denitrification in sediment determined from nitrogen isotope pairing. FEMS Microbiol. Ecol. 86:357–362 [Google Scholar]
- 20.Engström P, Dalsgaard T, Hulth S, Aller RC. 2005. Anaerobic ammonium oxidation by nitrite (anammox): implications for N2 production in coastal marine sediments. Geochim. Cosmochim. Acta 69:2057–2065 [Google Scholar]
- 21.Canfield DE, Jorgensen BB, Fossing H, Glud R, Gundersen J, Ramsing NB, Thamdrup B, Hansen JW, Nielsen LP, Hall POJ. 1993. Pathways of organic-carbon oxidation in 3 continental-margin sediments. Mar. Geol. 113:27–40 [DOI] [PubMed] [Google Scholar]
- 22.Rysgaard S, Fossing H, Jensen MM. 2001. Organic matter degradation through oxygen respiration, denitrification, and manganese, iron, and sulfate reduction in marine sediments (the Kattegat and the Skagerrak). Ophelia 55:77–91 [Google Scholar]
- 23.Kirkwood DS. 1992. Stability of solutions of nutrient salts during storage. Mar. Chem. 38:151–164 [Google Scholar]
- 24.Canfield DE, Thamdrup B, Hansen JW. 1993. The anaerobic degradation of organic-matter in Danish coastal sediments—iron reduction, manganese reduction, and sulfate reduction. Geochim. Cosmochim. Acta 57:3867–3883 [DOI] [PubMed] [Google Scholar]
- 25.Trimmer M, Maanoja S, Hildrew AG, Pretty JL, Grey J. 2010. Potential carbon fixation via methane oxidation in well-oxygenated riverbed gravels. Limnol. Oceanogr. 55:560–568 [Google Scholar]
- 26.Risgaard-Petersen N, Meyer RL, Schmid M, Jetten MSM, Enrich-Prast A, Rysgaard S, Revsbech NP. 2004. Anaerobic ammonium oxidation in an estuarine sediment. Aquat. Microb. Ecol. 36:293–304 [Google Scholar]
- 27.Penton CR, Devol AH, Tiedje JM. 2006. Molecular evidence for the broad distribution of anaerobic ammonium-oxidizing bacteria in freshwater and marine sediments. Appl. Environ. Microbiol. 72:6829–6832 [DOI] [PMC free article] [PubMed] [Google Scholar]
- 28.Strous M, Pelletier E, Mangenot S, Rattei T, Lehner A, Taylor MW, Horn M, Daims H, Bartol-Mavel D, Wincker P, Barbe V, Fonknechten N, Vallenet D, Segurens B, Schenowitz-Truong C, Medigue C, Collingro A, Snel B, Dutilh BE, Op den Camp HJM, van der Drift C, Cirpus I, van de Pas-Schoonen KT, Harhangi HR, van Niftrik L, Schmid M, Keltjens J, van de Vossenberg J, Kartal B, Meier H, Frishman D, Huynen MA, Mewes HW, Weissenbach J, Jetten MSM, Wagner M, Le Paslier D. 2006. Deciphering the evolution and metabolism of an anammox bacterium from a community genome. Nature 440:790–794 [DOI] [PubMed] [Google Scholar]
- 29.van de Vossenberg J, Woebken D, Maalcke WJ, Wessels HJCT, Dutilh BE, Kartal B, Janssen-Megens EM, Roeselers G, Yan J, Speth D, Gloerich J, Geerts W, van der Biezen E, Pluk W, Francoijs K-J, Russ L, Lam P, Malfatti SA, Tringe SG, Haaijer SCM, Op den Camp HJM, Stunnenberg HG, Amann R, Kuypers MMM, Jetten MSM. 2013. The metagenome of the marine anammox bacterium ‘Candidatus Scalindua profunda' illustrates the versatility of this globally important nitrogen cycle bacterium. Environ. Microbiol. 15:1275–1289 [DOI] [PMC free article] [PubMed] [Google Scholar]
- 30.Thamdrup B, Dalsgaard T. 2000. The fate of ammonium in anoxic manganese oxide-rich marine sediment. Geochim. Cosmochim. Acta 64:4157–4164 [Google Scholar]
- 31.Thamdrup B, Fossing H, Jorgensen BB. 1994. Manganese, iron, and sulfur cycling in a coastal marine sediment, Aarhus Bay, Denmark. Geochim. Cosmochim. Acta 58:5115–5129 [Google Scholar]
- 32.Leloup J, Fossing H, Kohls K, Holmkvist L, Borowski C, Jorgensen BB. 2009. Sulfate-reducing bacteria in marine sediment (Aarhus Bay, Denmark): abundance and diversity related to geochemical zonation. Environ. Microbiol. 11:1278–1291 [DOI] [PubMed] [Google Scholar]
- 33.Schmidt JL, Deming JW, Jumars PA, Keil RG. 1998. Constancy of bacterial abundance in surficial marine sediments. Limnol. Oceanogr. 43:976–982 [Google Scholar]
- 34.Dong LF, Smith CJ, Papaspyrou S, Stott A, Osborn AM, Nedwell DB. 2009. Changes in benthic denitrification, nitrate ammonification, and anammox process rates and nitrate and nitrite reductase gene abundances along an estuarine nutrient gradient (the Colne Estuary, United Kingdom). Appl. Environ. Microbiol. 75:3171–3179 [DOI] [PMC free article] [PubMed] [Google Scholar]
- 35.Dong LF, Sobey MN, Smith CJ, Rusmana I, Phillips W, Stott A, Osborn AM, Nedwell DB. 2011. Dissimilatory reduction of nitrate to ammonium, not denitrification or anammox, dominates benthic nitrate reduction in tropical estuaries. Limnol. Oceanogr. 56:279–291 [Google Scholar]
- 36.Dalsgaard T, Thamdrup B. 2002. Factors controlling anaerobic ammonium oxidation with nitrite in marine sediments. Appl. Environ. Microbiol. 68:3802–3808 [DOI] [PMC free article] [PubMed] [Google Scholar]
- 37.Neubacher EC, Parker RE, Trimmer M. 2011. Short-term hypoxia alters the balance of the nitrogen cycle in coastal sediments. Limnol. Oceanogr. 56:651–665 [Google Scholar]
- 38.Trimmer M, Nicholls JC, Morley N, Davies CA, Aldridge J. 2005. Biphasic behavior of anammox regulated by nitrite and nitrate in an estuarine sediment. Appl. Environ. Microbiol. 71:1923–1930 [DOI] [PMC free article] [PubMed] [Google Scholar]
- 39.Chang BX, Devol AH. 2009. Seasonal and spatial patterns of sedimentary denitrification rates in the Chukchi Sea. Deep Sea Res. Part II Top. Stud. Oceanogr. 56:1339–1350 [Google Scholar]
- 40.Koeve W, Kahler P. 2010. Heterotrophic denitrification vs. autotrophic anammox—quantifying collateral effects on the oceanic carbon cycle. Biogeosciences 7:2327–2337 [Google Scholar]
- 41.Hogslund S, Revsbech NP, Kuenen JG, Jorgensen BB, Gallardo VA, van de Vossenberg JV, Nielsen JL, Holmkvist L, Arning ET, Nielsen LP. 2009. Physiology and behaviour of marine Thioploca. ISME J. 3:647–657 [DOI] [PubMed] [Google Scholar]
- 42.Christensen PB, Rysgaard S, Sloth NP, Dalsgaard T, Schwaerter S. 2000. Sediment mineralization, nutrient fluxes, denitrification and dissimilatory nitrate reduction to ammonium in an estuarine fjord with sea cage trout farms. Aquat. Microb. Ecol. 21:73–84 [Google Scholar]
- 43.Rooks C, Schmid MC, Mehsana W, Trimmer M. 2012. The depth-specific significance and relative abundance of anaerobic ammonium-oxidizing bacteria in estuarine sediments (Medway Estuary, UK). FEMS Microbiol. Ecol. 80:19–29 [DOI] [PubMed] [Google Scholar]
- 44.Brandsma J, van de Vossenberg J, Risgaard-Petersen N, Schmid MC, Engström P, Eurenius K, Hulth S, Jaeschke A, Abbas B, Hopmans EC, Strous M, Schouten S, Jetten MSM, Sinninghe Damsté JS. 2011. A multi-proxy study of anaerobic ammonium oxidation in marine sediments of the Gullmar Fjord, Sweden. Environ. Microbiol. Rep. 3:360–366 [DOI] [PubMed] [Google Scholar]
- 45.Strous M, Kuenen JG, Jetten MSM. 1999. Key physiology of anaerobic ammonium oxidation. Appl. Environ. Microbiol. 65:3248–3250 [DOI] [PMC free article] [PubMed] [Google Scholar]
- 46.Gao H, Schreiber F, Collins G, Jensen MM, Svitlica O, Kostka JE, Lavik G, de Beer D, Zhou HY, Kuypers MMM. 2010. Aerobic denitrification in permeable Wadden Sea sediments. ISME J. 4:417–426 [DOI] [PubMed] [Google Scholar]
- 47.Gihring TM, Canion A, Riggs A, Huettel M, Kostka JE. 2010. Denitrification in shallow, sublittoral Gulf of Mexico permeable sediments. Limnol. Oceanogr. 55:43–54 [Google Scholar]
- 48.van de Leemput IA, Veraart AJ, Dakos V, de Klein JJM, Strous M, Scheffer M. 2011. Predicting microbial nitrogen pathways from basic principles. Environ. Microbiol. 13:1477–1487 [DOI] [PubMed] [Google Scholar]
- 49.Straub KL, Benz M, Schink B, Widdel F. 1996. Anaerobic, nitrate-dependent microbial oxidation of ferrous iron. Appl. Environ. Microbiol. 62:1458–1460 [DOI] [PMC free article] [PubMed] [Google Scholar]
- 50.Weber KA, Achenbach LA, Coates JD. 2006. Microorganisms pumping iron: anaerobic microbial iron oxidation and reduction. Nat. Rev. Microbiol. 4:752–764 [DOI] [PubMed] [Google Scholar]
- 51.Luther GW, Sundby B, Lewis BL, Brendel PJ, Silverberg N. 1997. Interactions of manganese with the nitrogen cycle: alternative pathways to dinitrogen. Geochim. Cosmochim. Acta 61:4043–4052 [Google Scholar]
Associated Data
This section collects any data citations, data availability statements, or supplementary materials included in this article.