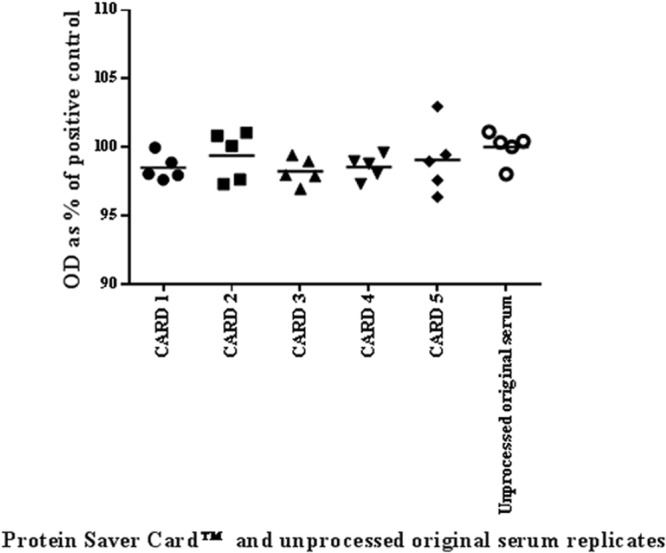
Fig 1.

Vertical scatter plot to compare replicates of a serum sample eluted from Protein Saver cards and replicates of the unprocessed original serum sample tested by smooth LPS iELISA. The black horizontal lines represent the mean values of 5 replicate eluates taken from each of 5 Protein Saver cards and the means of the unprocessed original serum replicates.
