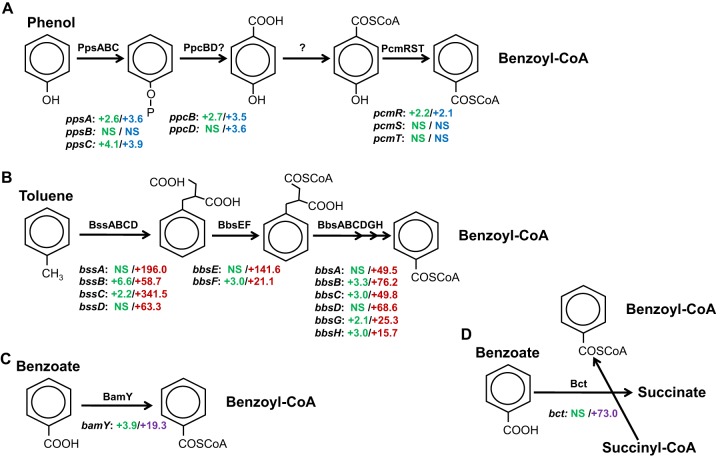
Fig 4.
Transcriptomic analysis of benzene degradation in G. metallireducens evaluating expression for genes specifically involved in the phenol (A), toluene (B), or benzoate (C, D) degradation pathways. The numbers next to the gene designations represent the fold change in transcript abundance determined with microarray analyses in benzene- versus acetate-grown cells (green), phenol- versus acetate-grown cells (blue), toluene- versus acetate-grown cells (red), or benzoate- versus acetate-grown cells (violet). The results are the means of triplicate determinations from each of three replicate cultures. NS, no significant change in gene expression. COSCoA, carbon-oxygen-sulfur-coenzyme A.

