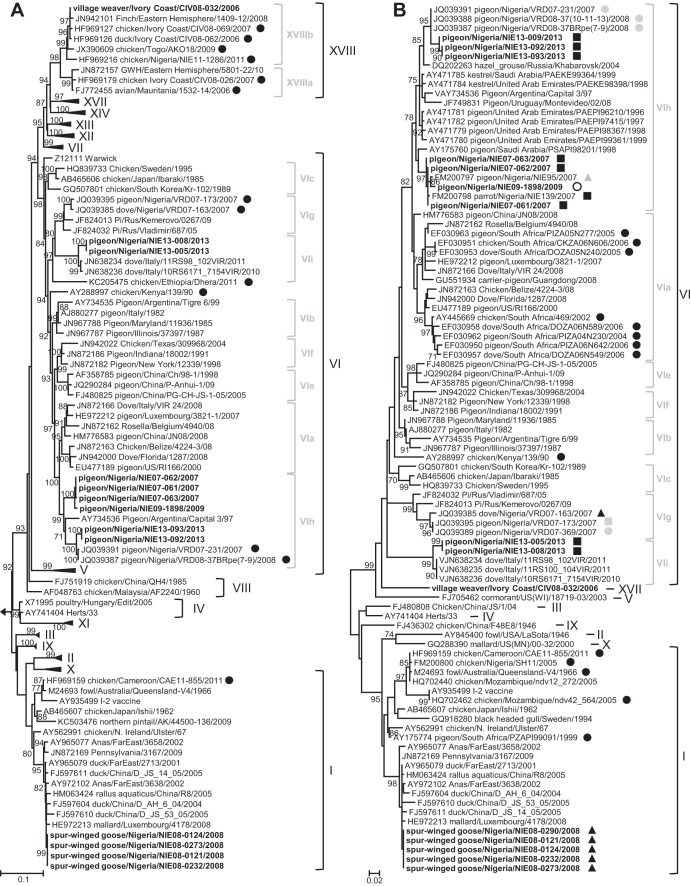
Fig 2.
Phylogenetic analysis of complete (1,662 nt) (A) or partial (372 nt) (B) F gene sequences. (A) Phylogenetic tree calculated with class I strain Goose/Alaska/415/1991 as the outgroup. Sequences generated in this study are in bold. Previously published sequences are indicated with their accession numbers. African strains are shown with black circles. (B) The state of origin of Nigerian sequences is indicated as follows: gray circles, Jigawa State; white circles, Lagos State; black squares, Oyo State; gray squares, Kano State; black triangles, Yobe State; gray triangles, Sokoto State. Only bootstrap values of ≥70% are shown. The scale corresponds to the number of base substitutions per site. GWH, green wood hoopoe.

