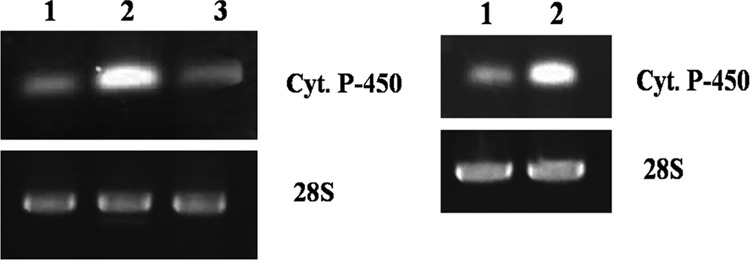
Fig 3.

Expression analysis of cytochrome P450 (upper panel) and 28S rRNA (lower panel) during cultivation of C. elegans with fluoranthene in various flasks (left), EF (lane 1), PMMA-CCF (lane 2), and GS-CCF (lane 3), and RDBR (right), without shaft rotation (lane 1) and with shaft rotation (lane 2), as determined by semiquantitative RT-PCR.
