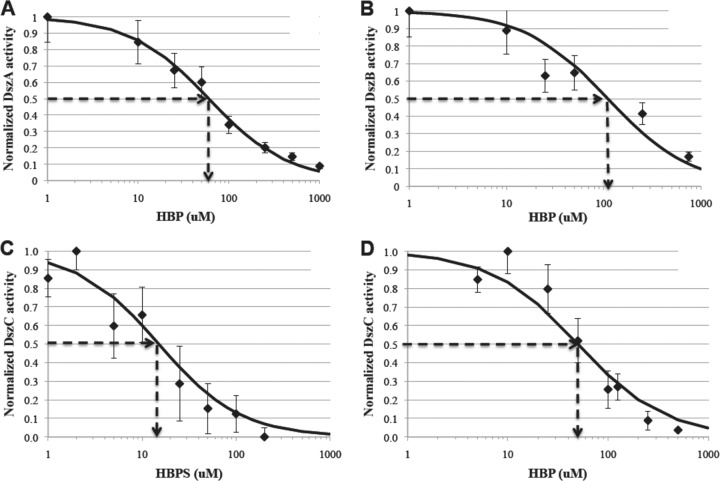
Fig 4.
Normalized desulfurization enzyme activity at different inhibitor concentrations for the four major inhibitory interactions identified in the 4S pathway. (A) DszA inhibition by HBP has an IC50 of 60 ± 5 μM; (B) DszB inhibition by HBP has an IC50 of 110 ± 10 μM; (C) DszC inhibition by HBPS has an IC50 of 15 ± 2 μM; (D) DszC inhibition by HBP has an IC50 of 50 ± 5 μM. Data shown are the averages and standard deviations of 3 replicates.

