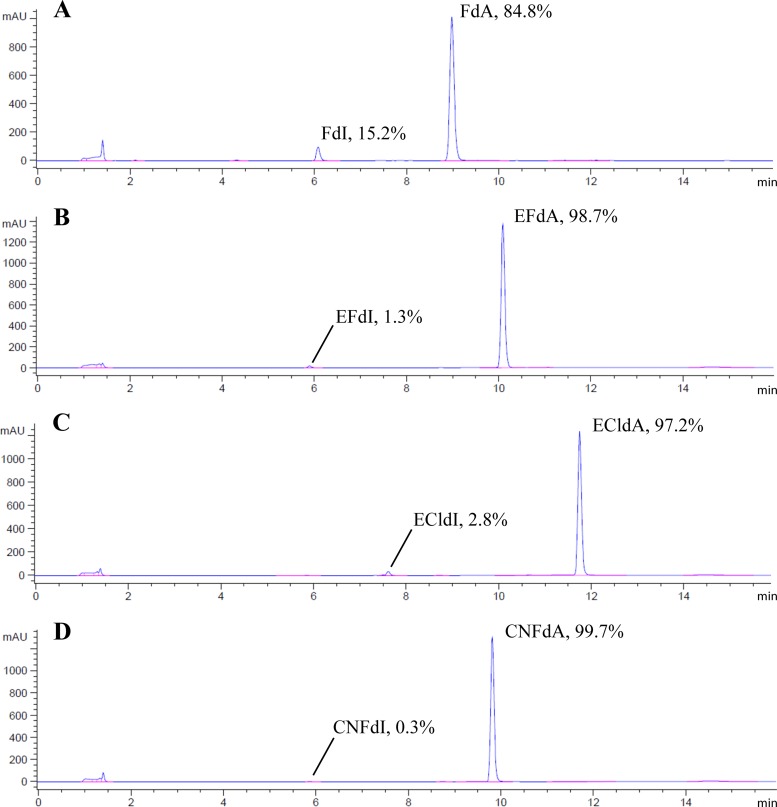
Fig 3.
HPLC data taken after reaction of dA analogs (500 μM) with ADA for 45 min (260-nm signal is shown in blue). FdA (A), EFdA (B), ECldA (C), and CNFdA (D) were converted to the corresponding deoxyinosine (dI) forms to different extents. Percentages of dA-based reactant and dI-based product were calculated based on peak areas.

