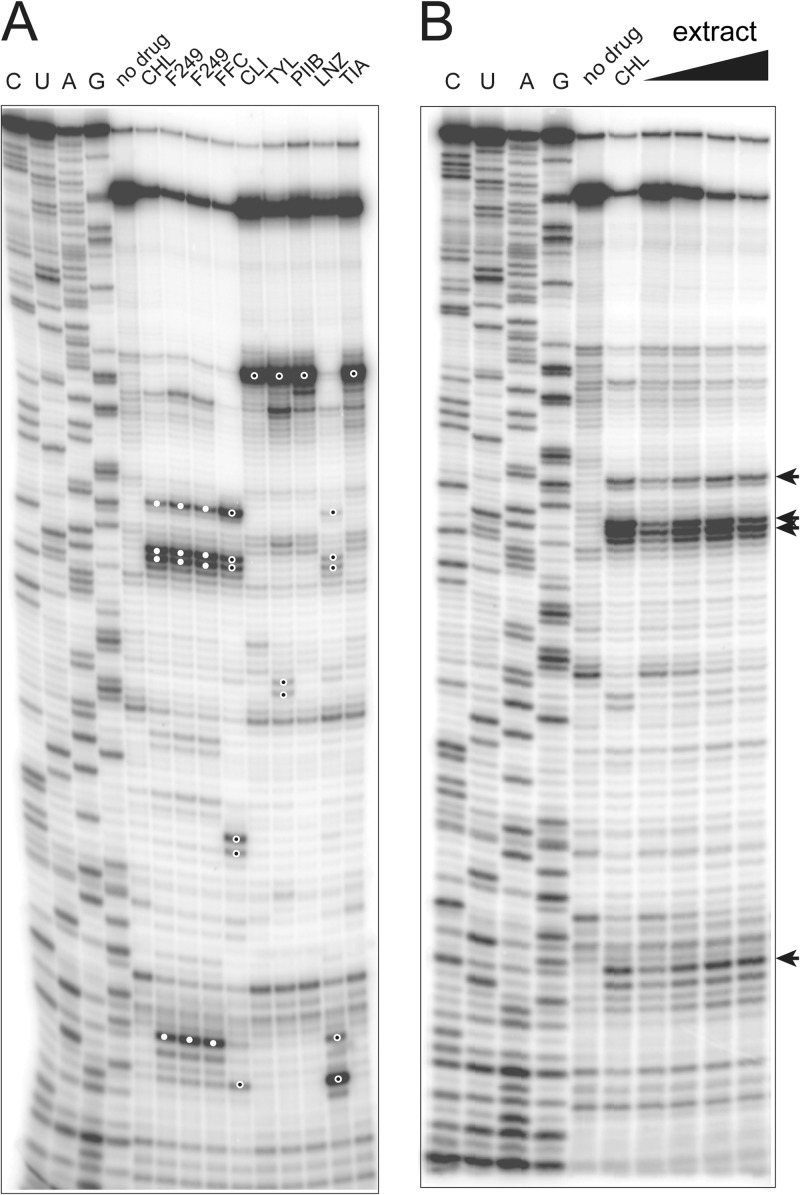
Fig 4.
Toe-printing analysis of the MOA of the translation inhibitor present in the G006 extract. (A) Comparative toe-printing was performed using the osmC template. For the better reproducibility, two independent samples with fraction G006-249 were independently processed. Characteristic toe-print bands obtained with the extract fractions and with chloramphenicol are indicated by filled white circles on the gel. The toe-printing bands in the other control samples, which do not match those observed with the extract, are marked with open circles. (B) Toe-printing in the presence of the crude material present in fraction 2 of the extract (0.25 to 2 mg/ml final concentration) (see Fig. S1 in the supplemental material).

