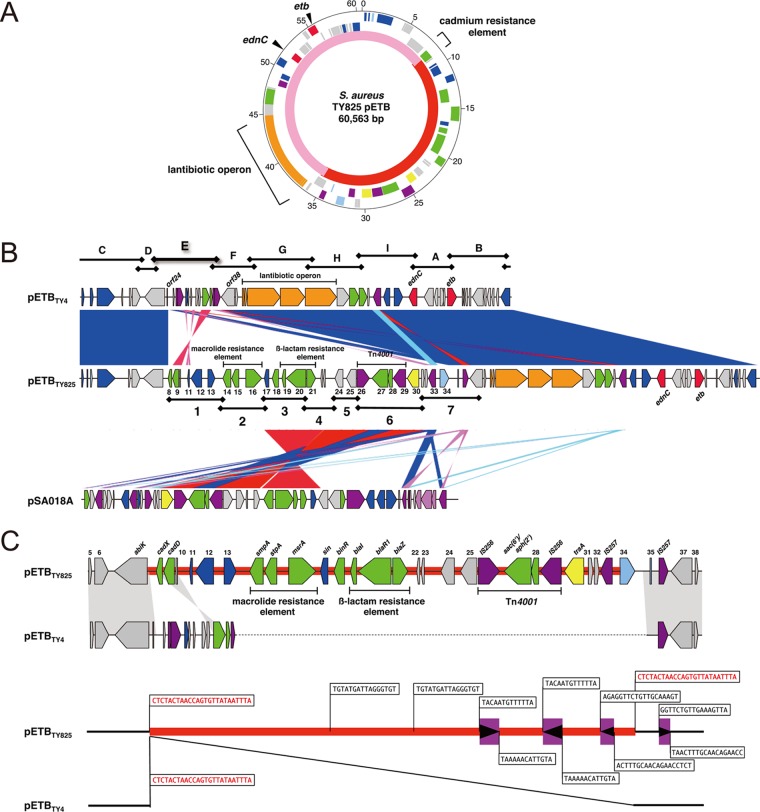
Fig 1.
(A) Circular genetic map of pETBTY825 from S. aureus TY825. From the outside in, the first circle shows the nucleotide sequence positions (in kb), the second and third circles show coding sequences transcribed clockwise and counterclockwise, respectively (red, pathogenic factor; green, antibiotic resistance gene; blue, DNA replication, recombination, and repair; light blue, transcription regulator; purple, transposase; yellow, conjugal transfer [tra]; orange, lantibiotic operon; and gray, conserved ORFs), and the fourth circle shows the backbone of pETBTY4 (pink) (GenBank accession no. AP003088) and the acquired region (red). (B) Structural comparison of pETBTY825 to pETBTY4 and the Staphylococcus plasmid pSA018A. Color shading indicates homologous regions. The approximately 16-kb extra DNA region of pETBTY825 was similarity matched with the Staphylococcus plasmid pSA018A (GenBank accession no. GQ900383). (C) IS elements are represented as purple boxes, and the directions of the transposase genes are indicated by arrowheads in the boxes. Sequences of the terminal inverted repeats of each IS elements are shown. Sequences of the terminal directed repeats of the acquired region (red) of pETBTY825 are shown.

