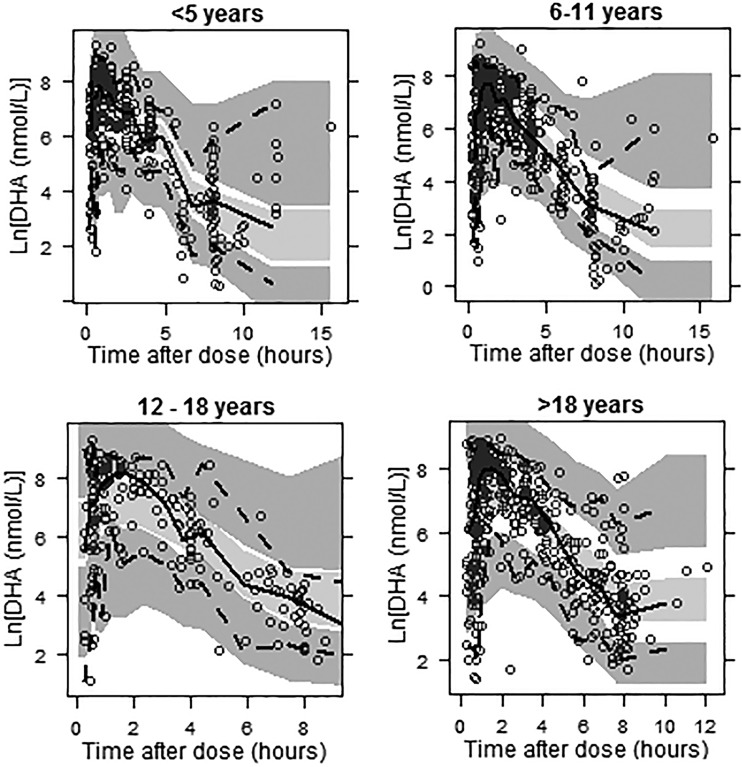
Fig 6.
VPC plots for DHA stratified by age for the full-population linear BSA model. The open circles represent the observed concentrations, the solid lines represent the median of the observed data, the dashed lines represent the 5th and 95th percentiles for the observed data, and the shaded areas represent the 95% confidence intervals surrounding the simulation-derived prediction intervals (5th, 50th, and 95th percentiles) obtained from the simulations.

