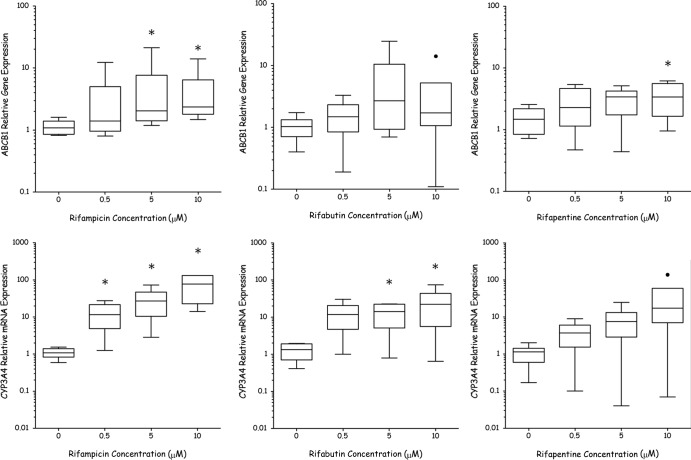
Fig 1.
Relative gene expression of cytochrome P450 isoenzyme 3A4 and ABCB1 in primary hepatocytes when incubated with rifampin (RIF), rifabutin (RBT), or rifapentine (RPT) at 0, 0.5, 5, and 10 μM. Data were normalized to results for GAPDH housekeeping gene and for control primary hepatocytes (0 μM) using the comparative CT method (CT = 2−ΔΔCT). Tukey box plot represents the means and interquartile ranges (IQR) (n = 6 donors completed in triplicate), with boxes showing IQR and whiskers representing <1.5 × IQR. Data outside 1.5 × IQR are labeled as outliers (•). An asterisk indicates a significant difference from the control (0 μM) by paired t test or Wilcoxon signed-rank test (P < 0.05).

