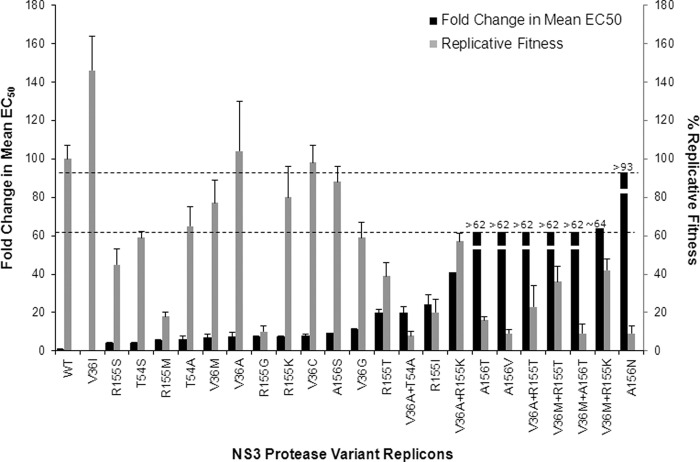
Fig 3.
Telaprevir EC50 fold change and in vitro replicative fitness of NS3 variants in G1b replicon cells. The fold change in mean EC50 and the SD were derived from Table 1 and plotted in the black bars corresponding to the y axis on the left. The replicative fitness (replication capacity) and the SD were derived from Table 5 and plotted in the gray bars corresponding to the y axis on the right. The upper dashed line represents the maximum change in EC50 (i.e., 93-fold) that could be detected in the 96-h EC50 assay. The lower dashed line represents the maximum change in EC50 (i.e., 62-fold) that could be detected in the 48-h EC50 assay. The fold changes in EC50 above the maximum detection limits are represented with the “>” sign.

