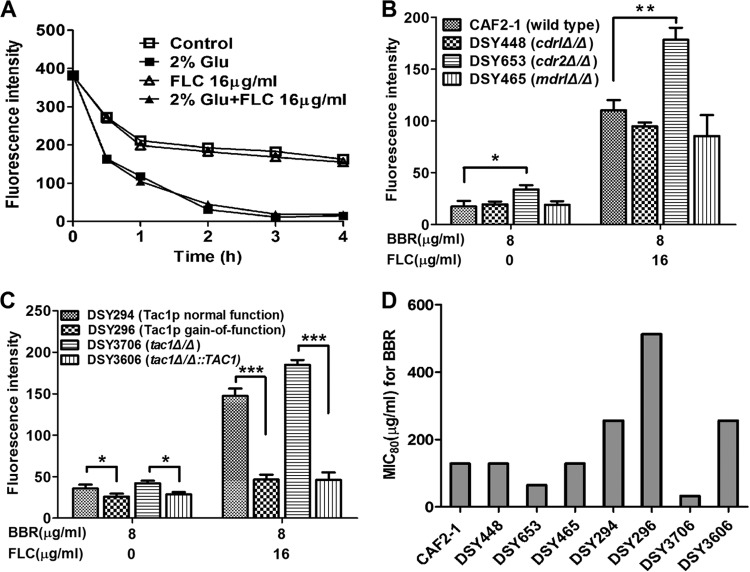
Fig 8.
(A) Efflux of intracellular BBR. Strains were treated with 16 μg/ml of FLC and 8 μg/ml of BBR for 8 h in RPMI 1640 medium, washed twice with PBS, and then resuspended with RPMI 1640 medium at 5 × 10⁷ cells/ml. With the addition of 2% glucose (Glu) or 16 μg/ml of FLC, BBR fluorescence measurement was performed with an Infinite 200 Universal microplate reader at 405-nm excitation and 520-nm emission wavelengths over time. (B and C) Intracellular BBR accumulation of different strains. Strains were treated with different concentrations of FLC and BBR, and fluorescence intensity was measured at 8 h. Statistical significance among groups was determined by analyses of variance. Comparison between two groups was performed by Student t test. The data are shown as means ± SDs from three independent experiments. *, P < 0.05; **, P < 0.01; ***, P < 0.001. (D) Susceptibilities of different C. albicans strains to BBR. The strains included CAF2-1 (wild type), DSY448 (cdr1Δ/Δ), DSY653 (cdr2Δ/Δ), DSY465 (mdr1Δ/Δ), DAY294 (Tac1p normal-function strain), DAY296 (Tac1p gain-of-function mutant), DAY3706 (tac1Δ/Δ), and DAY3606 (tac1Δ/Δ::TAC1).

