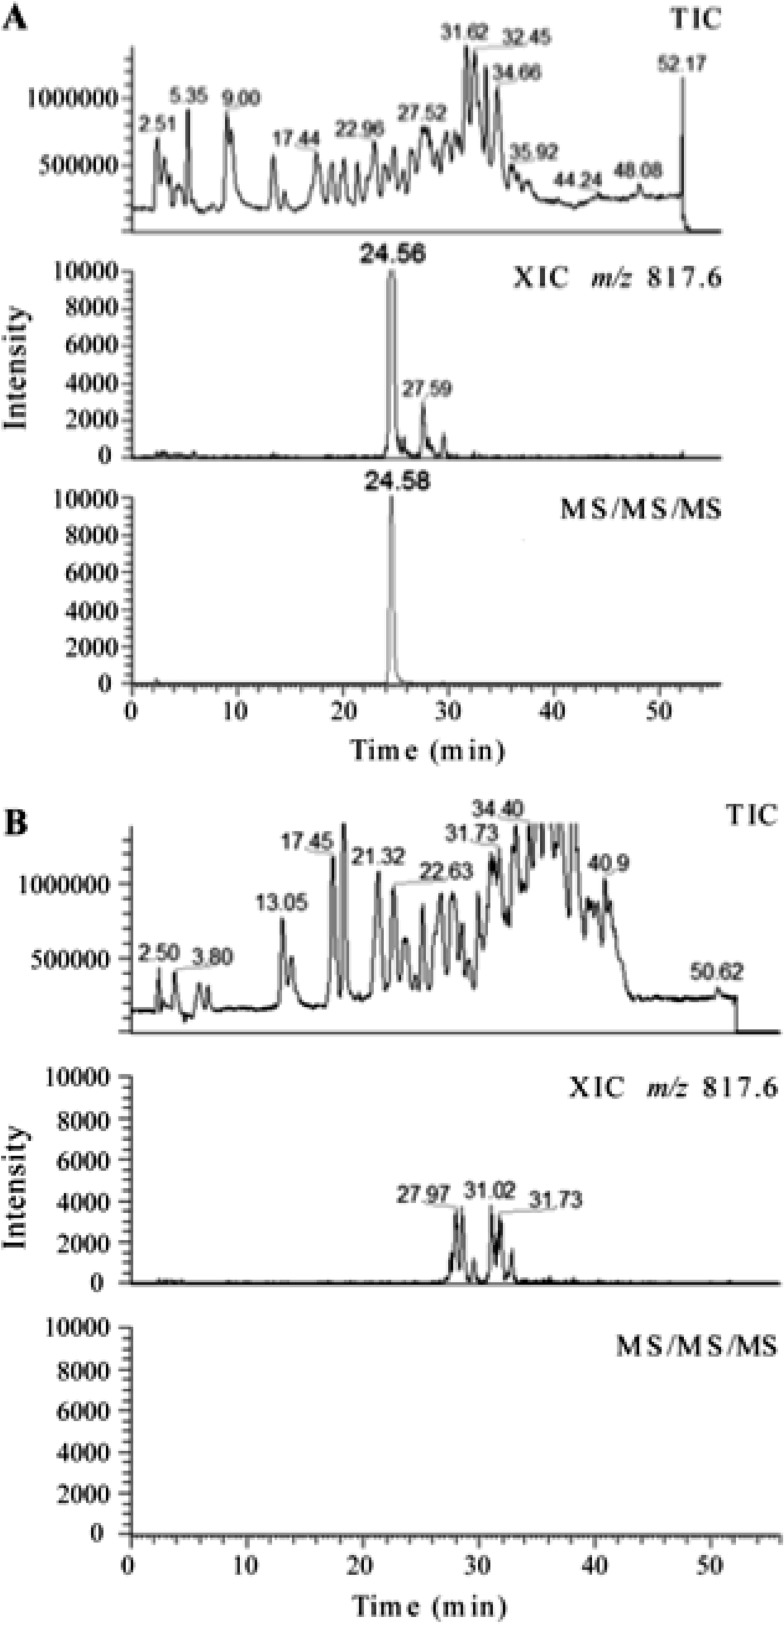
Fig 2.
A comparative LC-MS (multiple-stage mass spectrometry) analysis of the RNase T1 digest of 16S rRNA purified from strain H37Rv (A) and strain ΔgidB (B) shown to scale. (A) The top chromatogram is the total ion chromatogram (TIC) of the RNase T1 digest of 5 μg of 16S rRNA from H37Rv. The middle chromatogram shows a well-defined peak for m/z 817.6, which corresponds to the modification of the specific oligonucleotide CC[mG]CG. The bottom chromatogram shows the peak for multiple-stage mass spectrometry of the analyte ion, where m/z 817.6 was subjected to a first stage of fragmentation (MS/MS) and the resulting most abundant fragment ion m/z 735.1 was subjected to a second stage of fragmentation (MS/MS/MS). Only an ion that generates m/z 735.1 from m/z 817.6 yields a response in this analysis. (B) The top chromatogram is the TIC of the RNase T1 digest of 7 μg of 16S rRNA from strain ΔgidB. The middle chromatogram does not show a well-defined peak for m/z 817.6. The bottom chromatogram corresponds to the multiple-stage mass spectrometry of the analyte ions as described above. The absence of any response represented in the bottom chromatogram indicates the lack of a methylguanine base loss from the oligonucleotides that yielded a response in the first stage of tandem mass spectrometry shown in the middle chromatogram.

