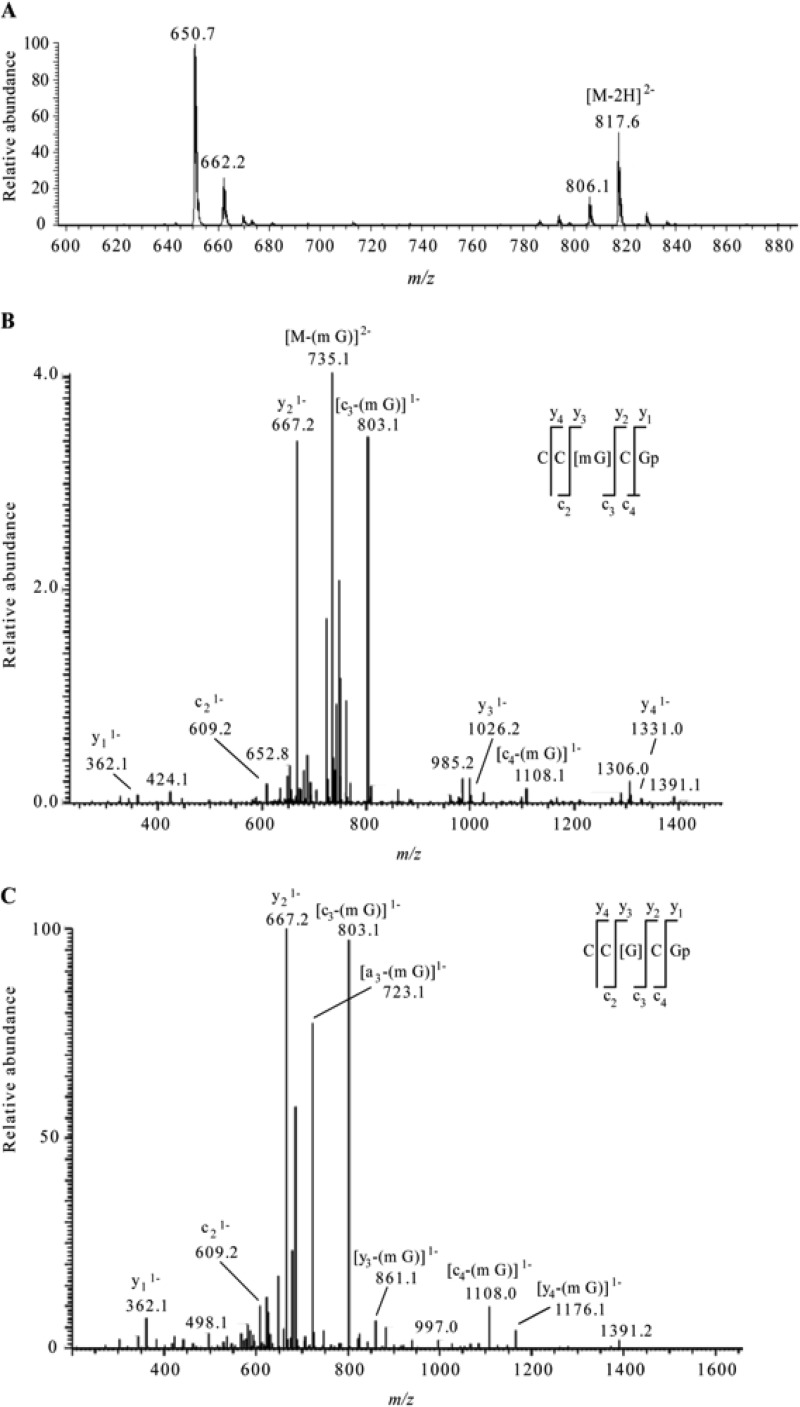
Fig 3.
(A) Electrospray mass spectrum corresponding to the peak seen in the extracted ion chromatogram for m/z 817.6 of the RNase T1 digest of 5 μg of 16S rRNA from H37Rv M. tuberculosis (Fig. 2A, middle chromatogram). The mass spectral data are consistent with the doubly charged ion that would be expected for CC[mG]CG. The other m/z values in this mass spectrum correspond to additional RNase T1 digestion products from 16S rRNA. (B) Collision-induced dissociation (CID) mass spectrum of the RNase T1 digestion product at m/z 817.6 shown in panel A. (C) CID mass spectrum of the fragment with m/z 735.1 shown in panel B. The observed sequence-informative fragments correspond to the expected fragmentation pattern of oligonucleotide CC[mG]CG, which has an mG-base loss. The absence of mG is depicted as [G] in the sequence representation. Sequence-informative fragment ions are labeled following the nomenclature of McLuckey et al. (31).

