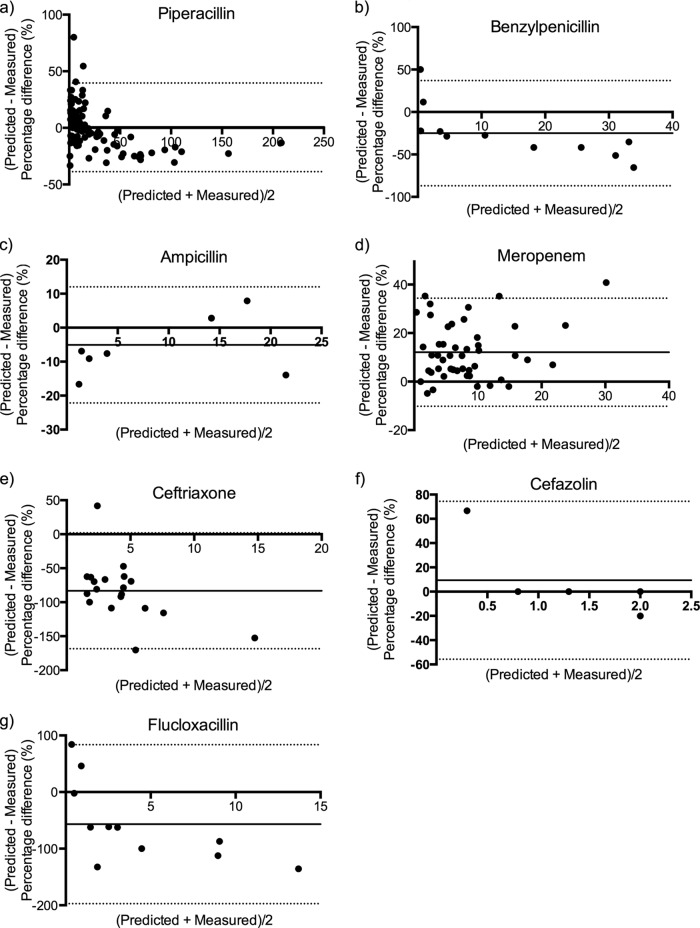
Fig 2.
Bland-Altman plots of relative difference (percentage of measured unbound concentrations) against the mean of predicted and measured unbound concentrations for piperacillin (n = 94; ρ = −0.51; P < 0.01) (a), ampicillin (n = 8; ρ = 0.42; P = 0.30) (b), benzylpenicillin (n = 11; ρ = −0.92; P < 0.01) (c), meropenem (n = 49; ρ = 0.02; P = 0.91) (d), ceftriaxone (n = 19; ρ = −0.43; P = 0.07) (e), cefazolin (n = 5; ρ = −0.80; P < 0.01) (f), and flucloxacillin (n = 11; ρ = −0.81; P < 0.01) (g). The biases and 95% limits of agreement are shown as solid and broken horizontal lines, respectively.

