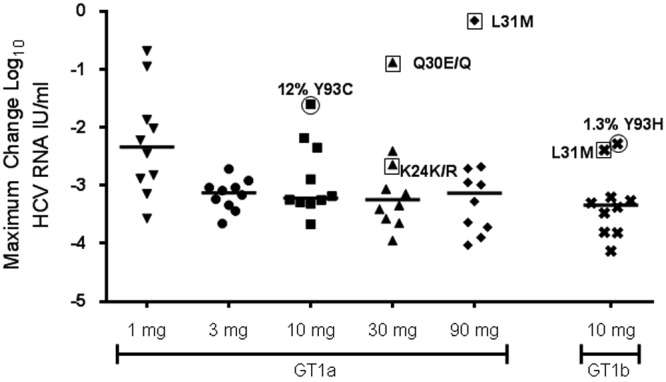
Fig 1.

Maximal reduction in HCV RNA log10 IU/ml by cohort. The maximal change from baseline in HCV RNA is plotted for each individual subject receiving active GS-5885 in study GS-US-256-0102 (median indicated). NS5A was population sequenced for all subjects at baseline. Resistance-associated mutations detected at baseline by population sequencing are labeled and enclosed by a square. Circled subjects had resistance-associated mutations detected as minority variants by deep sequencing at baseline but not detected by population sequencing. The percentage of resistance variants present at baseline is indicated for the circled patients.
