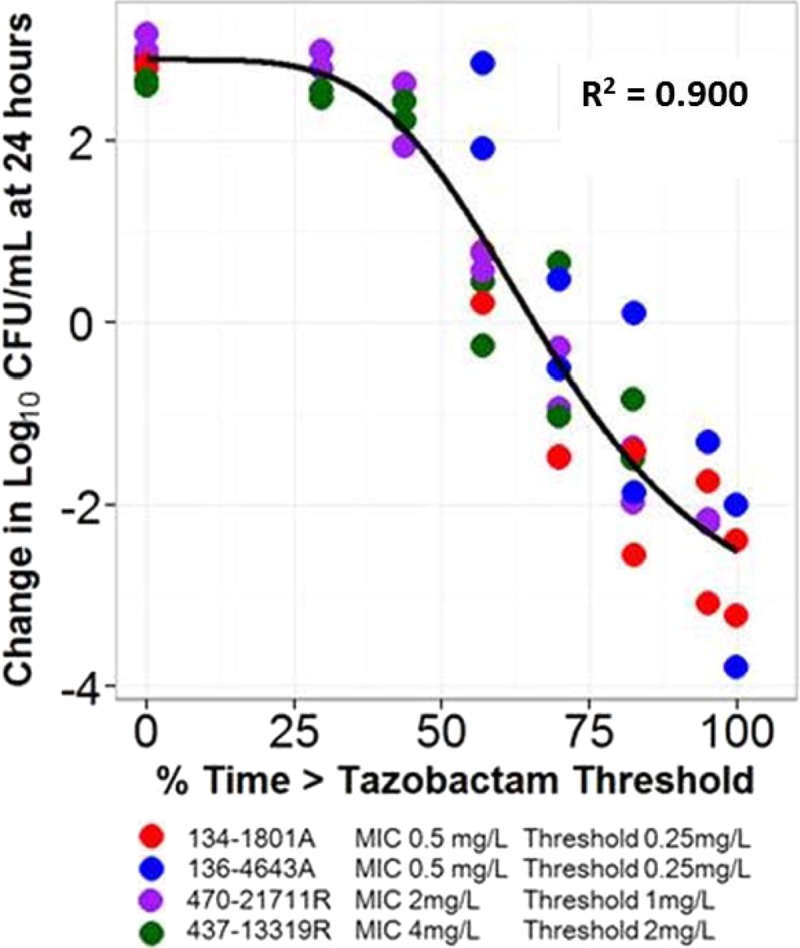
Fig 4.

Relationship between tazobactam %Time>threshold and change in log10 CFU from baseline at 24 h for the four E. coli clinical isolates in a PK-PD in vitro infection model. Isolates are represented by different colors. The black line represents the fitted function for the pooled data across isolates. The threshold for each isolate represented the product of the ceftolozane-tazobactam MIC for the individual isolate and 0.5.
