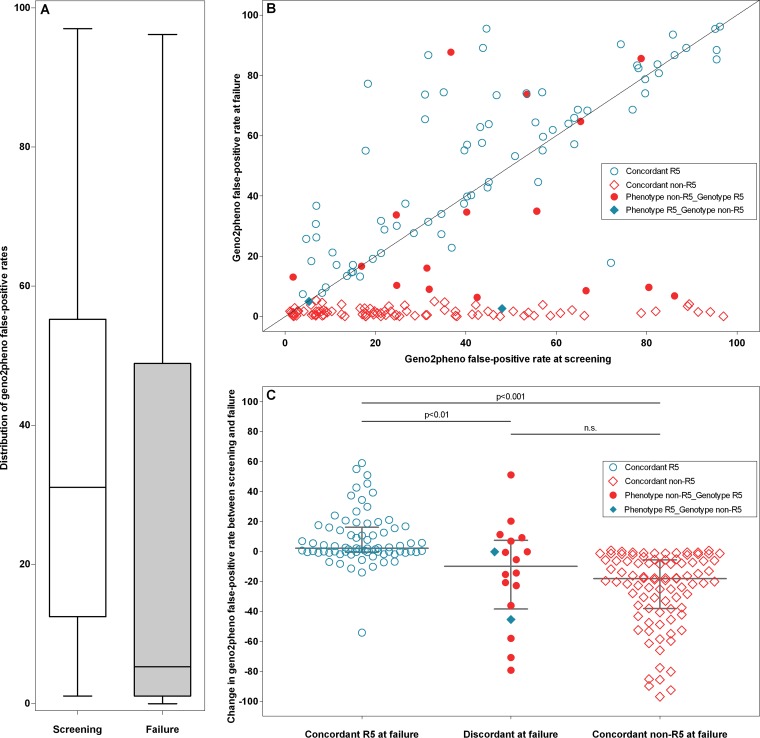
Fig 1.
(A) Overall decrease in the geno2pheno false-positive rate (FPR) values between screening and failure. The distribution of geno2pheno FPR values is shown for the screening (left) and failure (right) sequences. Boxes indicate the interquartile ranges of the values, with the median values indicated by a solid horizontal line. Whiskers correspond to 1.5 times the interquartile range. (B) geno2pheno false-positive rates at screening and failure. Shown is a scatter plot of the geno2pheno FPRs for all patients with coordinates at two time points, with screening values on the horizontal axis and failure values on the vertical axis. Points are marked by whether tropism results at failure were concordant between phenotype and genotype determinations (see key). The geno2pheno FPR decreased by a large amount between screening and failure for patients in the non-R5 group but changed very little for those in the R5 group. (C) Change in geno2pheno false-positive rates between screening and failure. Shown is a scatter plot of the false-positive rate change between screening and failure. Horizontal lines denote the median values, with error bars indicating the interquartile ranges. Patients with concordant R5 tropism at failure had a median FPR change of 2 (IQR, −1 to 16), versus a median decline of 18 FPR units (IQR, −38 to −6) in the concordant non-R5 group (P < 0.001). Patients with discordant results at failure had an overall intermediate FPR decline (median FPR change, 10; IQR, −39 to 7). Points are marked by whether tropism results at failure were concordant between phenotype and genotype determinations (see key).

