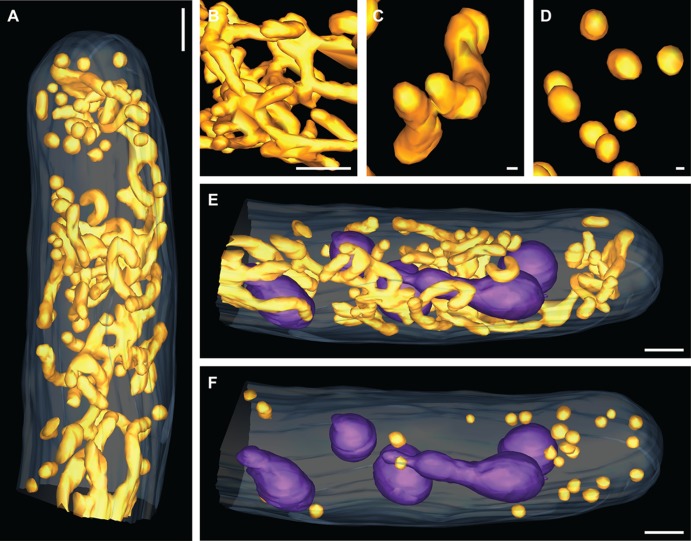
Fig 3.
Highly branched mitochondrial network with a polarized spherical fraction. (A) Electron tomographic model view of mitochondria subcellular organization within a hyphal tip region (the plasma membrane [light blue] and mitochondrial network [orange] are indicated). Bar, 1 μm. (B) Close-up view of branched mitochondria. Bar, 300 nm. (C) Close-up view of tubular mitochondria. Bar, 30 nm. (D) Close-up view of spherical mitochondria. Bar, 30 nm. (E) Electron tomographic model view of branched and tubular mitochondrial organization around nuclei within a hyphal tip region (the plasma membrane [light blue], nuclei [purple], and mitochondrial network [orange] are indicated). Bar, 1 μm. (F) Electron tomographic model view of spherical mitochondrial organization within a hyphal tip region (the plasma membrane [light blue], nuclei [purple], and mitochondrial network [orange] are indicated). Bar, 1 μm.

