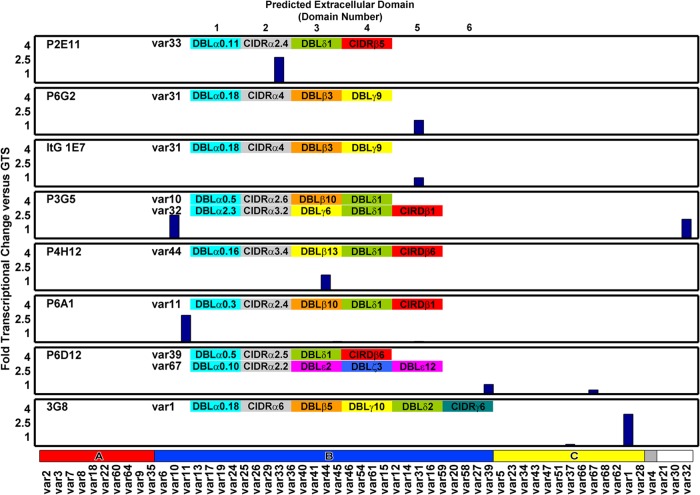
Fig 2.
Analysis of var gene transcription in parasite lines at the time of the pRBC binding analysis. RNA was harvested from ring-stage parasites, and var gene expression profiling was performed by RT-qPCR. Most clonal variants expressed a single primary var transcript, and two of the clonal lines expressed a second var transcript. The domain structure of the dominantly expressed var gene(s) is given in each plot. Gene expression is normalized to the housekeeping control gene GTS. The var gene primer set is arranged by Ups category: UpsA (red), UpsB (blue), UpsC (yellow), UpsE (gray), and unknown (white). The predicted extracellular domain structure for each var gene transcript is shown at the top of each plot.

