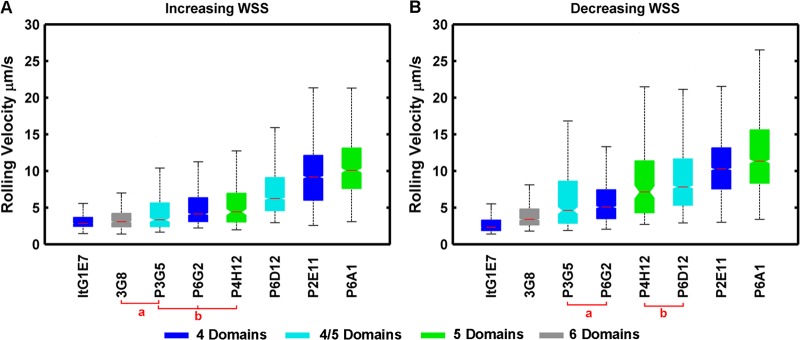
Fig 5.

Rolling-velocity comparison and ordered rank of clonal variants at 1.6 Pa. The colors of the bars correspond to the number of extracellular domains in the predominantly expressed var product(s). Clones marked a and b are not significantly different from one another but are significantly different from other parasite clones, as indicated by overlapping confidence intervals (notches). The boxes represent the 25th and 75th percentiles, while the whiskers represent the 2.7 and 97.3 percentiles. The notches represent the 95% confidence interval about the median (horizontal line).
