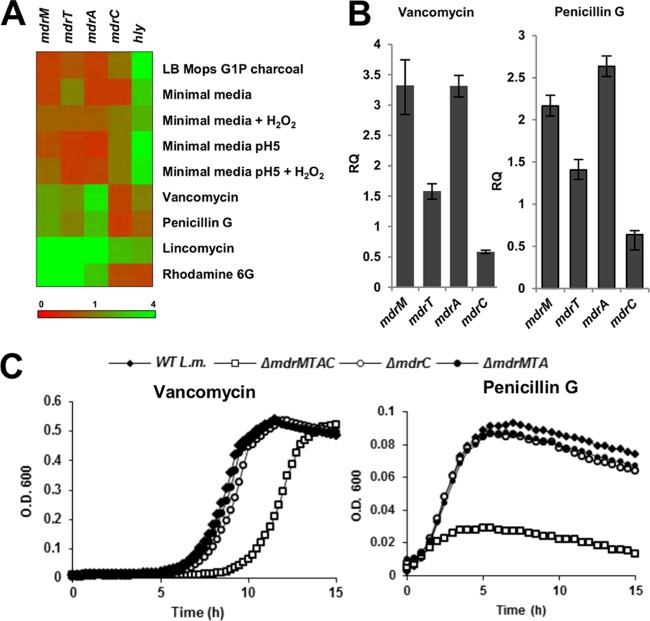
Fig 4.
MdrM-like transporters are required for cell wall stress responses. (A) RT-qPCR analysis, presented as a heat map, of transcriptional levels of the mdrM, mdrT, mdrA, mdrC, and hly genes in WT L. monocytogenes grown under different in vitro conditions: BHI supplemented with vancomycin (1 μg ml−1), penicillin G (0.08 μg ml−1), lincomycin (3 μg ml-1), or rhodamine 6G (50 μM); LB with MOPS (morpholinepropanesulfonic acid) and G1P charcoal; or minimal medium at pH 7, minimal medium at pH 5, or minimal medium with H2O2 at pH 5. Transcription levels are represented as relative quantity (RQ) compared to the levels in BHI or in minimal medium at pH 7, respectively. Data represent 3 biological repeats. In all samples, statistical deviation did not exceed 15% with a 95% confidence level. (B) RT-qPCR analysis of transcriptional levels of the mdrM, mdrT, mdrA, and mdrC genes in WT L. monocytogenes grown in BHI supplemented with vancomycin (1 μg ml−1) or penicillin G (0.08 μg ml−1) for 2 h. Transcription levels (RQ) are relative to the levels in BHI without drugs. The data represent 3 biological repeats. Error bars represent 95% confidence intervals. (C) Growth curve of WT L. monocytogenes and MDR mutants in BHI medium supplemented with vancomycin (1 μg ml−1) or penicillin G (0.08 μg ml−1). The data represent 3 biological repeats. The experiment was performed in a 96-well format in a Synergy HT Biotek plate reader. Representative growth curves are shown. Error bars representing the standard deviation of the triplicate sample are hidden by the symbols. Growth curve experiments were performed in at least 3 independent biological repeats.

