
Fig 5.
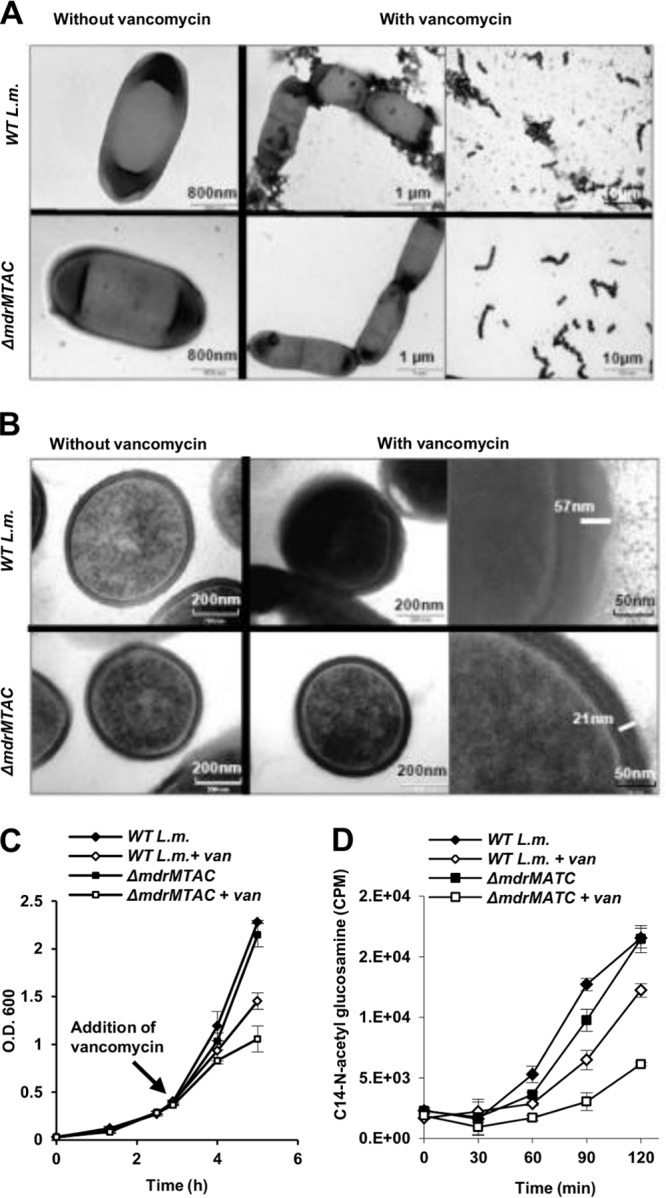
The ΔmdrMTAC mutant does not overproduce peptidoglycan in response to vancomycin stress. (A) Negative-staining TEM images of WT L. monocytogenes and the ΔmdrMTAC mutant grown with and without vancomycin treatment. Growth curves are presented in panel C. (B) TEM section images of WT L. monocytogenes and the ΔmdrMTAC mutant grown with and without vancomycin treatment. Growth curves are presented in panel C. Images in panels A and B represent 3 independent biological repeats; a total of 35 frames were taken for each strain and condition. (C) Growth curves of bacteria taken for TEM analysis (A and B). Vancomycin (1 μg ml−1) was added at an OD600 of 0.4, and bacteria were harvested 2 h later for fixation and staining. The data are means of 3 independent biological experiments. Error bars represent standard deviations. (D) Analysis of the peptidoglycan synthesis rate in WT L. monocytogenes and the ΔmdrMTAC mutant, grown with and without vancomycin (0.8 μg ml−1) treatment, as measured by incorporation of 14C-N-acetylglucosamine. Vancomycin and N-acetylglucosamine were added during bacterial growth at an OD600 of 0.4, and incorporation of 14C-N-acetylglucosamine was analyzed at 30-min intervals upon addition (see the growth curves presented in Fig. S4 in the supplemental material). Error bars represent standard deviations of triplicate samples. The data represent 2 biological repeats.