Fig 7.
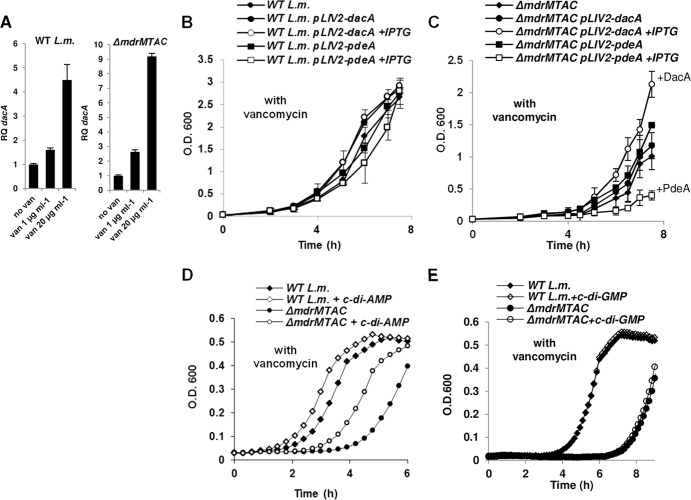
Mdr-MTAC transporters and c-di-AMP are functionally associated in the response to cell wall stress. (A) RT-qPCR analysis of transcriptional levels of the dacA gene in WT L. monocytogenes and ΔmdrMTAC bacteria grown in BHI or supplemented with vancomycin (van; 1 μg ml−1 for 2 h or 20 μg ml−1 for 10 min). Transcription levels are represented as relative quantity (RQ) compared to the levels in BHI alone. The data represent 3 biological independent repeats. Error bars represent 95% confidence intervals (as described in Materials and Methods). (B) Growth curves of WT L. monocytogenes strains harboring the pLIV2 plasmid with an IPTG-inducible promoter, expressing dacA or pdeA genes in BHI supplemented with vancomycin (1 μg ml−1) with or without IPTG. The experiment was performed in flasks. The data are means of 3 independent biological experiments. Error bars represent standard deviations. (C) Growth curves of ΔmdrMTAC bacteria harboring the pLIV2 plasmid with an IPTG-inducible promoter expressing the dacA or pdeA genes in BHI supplemented with vancomycin with or without IPTG. The experiment was performed in flasks. The data are means of 3 independent biological experiments. Error bars represent standard deviations. (D) Growth curve of WT L. monocytogenes or the ΔmdrMTAC mutant in BHI supplemented with vancomycin with and without addition of 3 μg ml−1 c-di-AMP. This experiment was performed in 3 biological repeats in a 96-well format in a Synergy HT Biotek plate reader. Growth curves from one representative experiment are shown. Error bars representing standard deviations of a triplicate sample are hidden by the symbols. (E) Growth curve of WT L. monocytogenes or the ΔmdrMTAC mutant in BHI supplemented with vancomycin with and without addition of 3 μg ml−1 c-di-GMP. The experiment was performed in 3 biological repeats in a 96-well format in a Synergy HT Biotek plate reader. Growth curves from one representative experiment are shown. Error bars representing standard deviations of a triplicate sample are hidden by the symbols.

