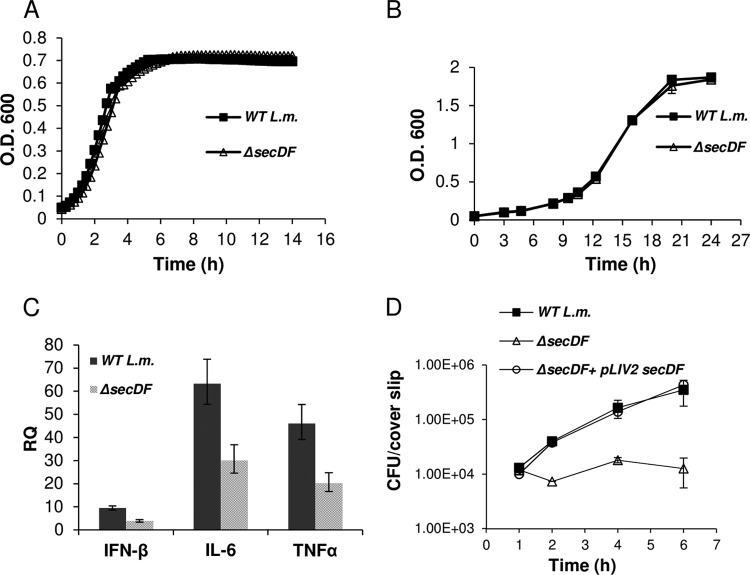
Fig 1.
ΔsecDF mutant shows restricted intracellular growth and a decreased cytokine response upon macrophage infection. (A) Growth curves of WT L. monocytogenes and the ΔsecDF mutant grown in BHI laboratory medium at 37°C. Representative growth curves are shown. Error bars represent the standard deviations from triplicate trials and are hidden by the symbols. Growth curves were performed in 3 biological repeats (n = 3). (B) Growth curves of WT L. monocytogenes and ΔsecDF mutant grown in BHI laboratory medium at 15°C. Data shown represent the means from 3 biological repeats (n = 3). Error bars represent the standard deviations. O.D. 600, optical density at 600 nm. (C) RT-qPCR analysis of the IFN-β, IL-6, and TNF-α transcription levels in BMD macrophages infected with WT L. monocytogenes or the ΔsecDF mutant (MOI of 1) at 6 h p.i. Transcription levels are represented as the relative quantity (RQ) relative to the levels in uninfected cells. The data represent 3 biological repeats (n = 3). Error bars represent a 95% confidence interval, i.e., P ≪ 0.01. (D) Intracellular growth curves of the WT L. monocytogenes, ΔsecDF mutant, and ΔsecDF complemented strain harboring pLIV2-secDF plasmid grown in BMD macrophages. Error bars represent the standard deviations from triplicate trials. The data represent 3 independent biological repeats (n = 3).

