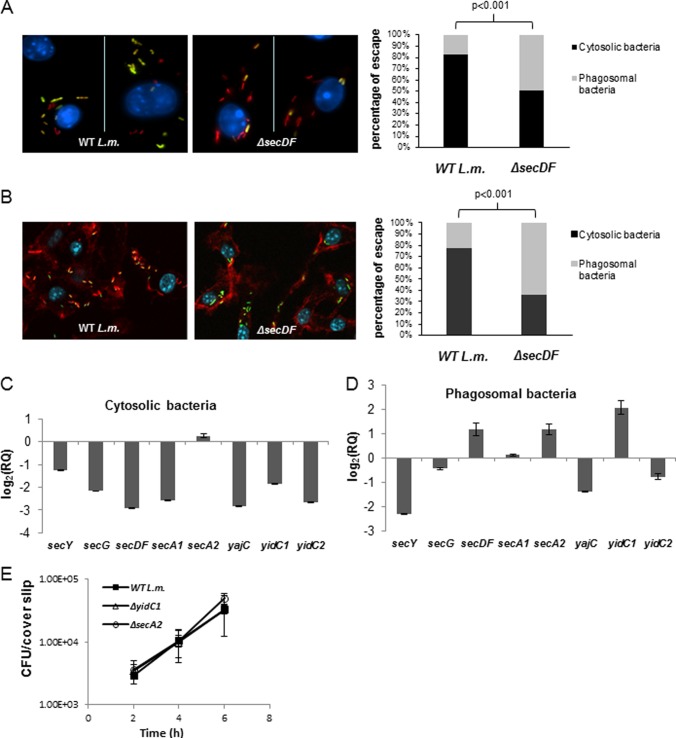
Fig 2.
SecDF contributes to phagosomal escape. (A, left) Confocal fluorescence microscope images of digitonin-treated BMD macrophages infected with mCherry expressing WT L. monocytogenes or ΔsecDF bacteria at 3 h p.i. Cytosolic bacteria were labeled with fluorescein-conjugated anti-Listeria antibody (green), and macrophage nuclei were labeled with DAPI (blue). (Right) percentage of bacteria that escaped macrophage phagosomes at 3 h p.i. as determined by a microscopic fluorescence assay based on selective digitonin membrane permeabilization. The results are representative of 10 microscopic images from 2 independent biological repeats for each strain (in each repeat between 300 and 400 bacteria were counted). The P value was calculated using a chi-square test. (B, left) Confocal fluorescence microscope images of BMD macrophages infected with WT L. monocytogenes or ΔsecDF mutant bacteria at 3 h p.i. Bacteria were labeled with fluorescein-conjugated anti-Listeria antibody (green), macrophage nuclei were labeled with DAPI (blue), and macrophage actin filaments were labeled with rhodamine phalloidin (red). (Right) Percentage of bacteria that escaped macrophage phagosomes at 3 h p.i. as determined by a microscopic fluorescence assay based on actin labeling. The results are representative of 10 microscopic images from 3 independent biological repeats for each strain (in each image, between 50 and 100 bacteria were counted). The P value was calculated using a chi-square test. (C) RT-qPCR transcription analysis of different sec-related genes in intracellularly grown (cytosolic) bacteria (WT L. monocytogenes) in macrophages at 6 h p.i. Transcription levels were measured as relative quantity (RQ), i.e., relative to their levels in bacteria grown exponentially in BHI laboratory medium. Data are presented as log2 values of the RQ. The data represent 3 biological repeats (n = 3). Error bars represent a 95% confidence interval. (D) RT-qPCR transcription analysis of different sec-related genes in phagosomally trapped bacteria (Δhly mutant) in macrophages at 2.5 h p.i. Transcription levels were measured as the RQ relative to their levels in bacteria grown exponentially in BHI laboratory medium. Data are presented as log2 values of RQ. The data represent 3 biological repeats (n = 3). Error bars represent a 95% confidence interval, i.e., P ≪ 0.01. (E) Intracellular growth curves of WT L. monocytogenes and the ΔyidC1 and ΔsecA2 mutants in BMD macrophages. Error bars represent the standard deviations from triplicate trials. The data represent 3 independent biological repeats (n = 3).

