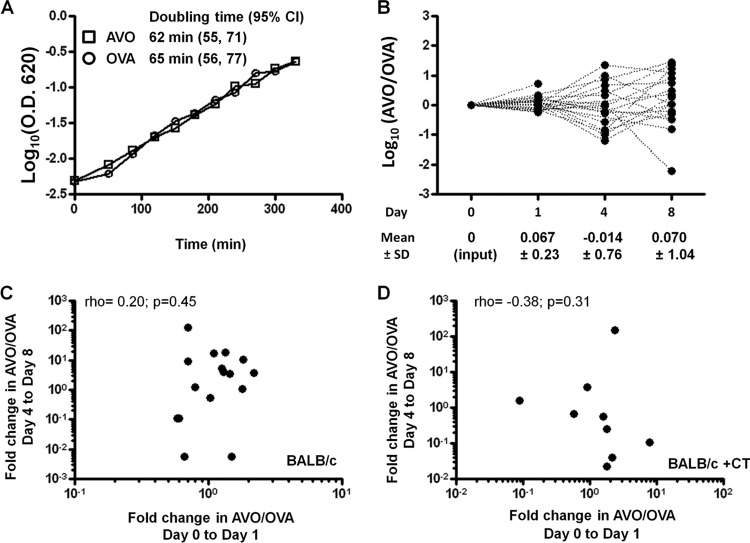
Fig 1.
AVO and OVA are neutral alleles and show genetic drift during nasal carriage. (A) The AVO and OVA strains were cultured in THY medium at 37°C, and the increase in OD620 was measured every 30 min. The curve was fitted to an exponential growth to estimate the average doubling time. (B) Twenty BALB/c mice were intranasally challenged by a 1:1 mixture of the AVO and OVA strains (day 0). The AVO/OVA ratio in mouse nasal wash was measured on days 1, 4, and 8. Each dashed line connects points for the same mouse over time. (C) Scatter plots to examine correlation between the change in AVO/OVA from day 0 to day 1 and the change in AVO/OVA from day 4 to day 8 in BALB/c mice. (D) Scatter plots to examine correlation between the change in AVO/OVA from day 0 to day 1 and the change in AVO/OVA from day 4 to day 8 in BALB/c mice who had been treated with cholera toxin (CT) 4 weeks prior to challenge.

