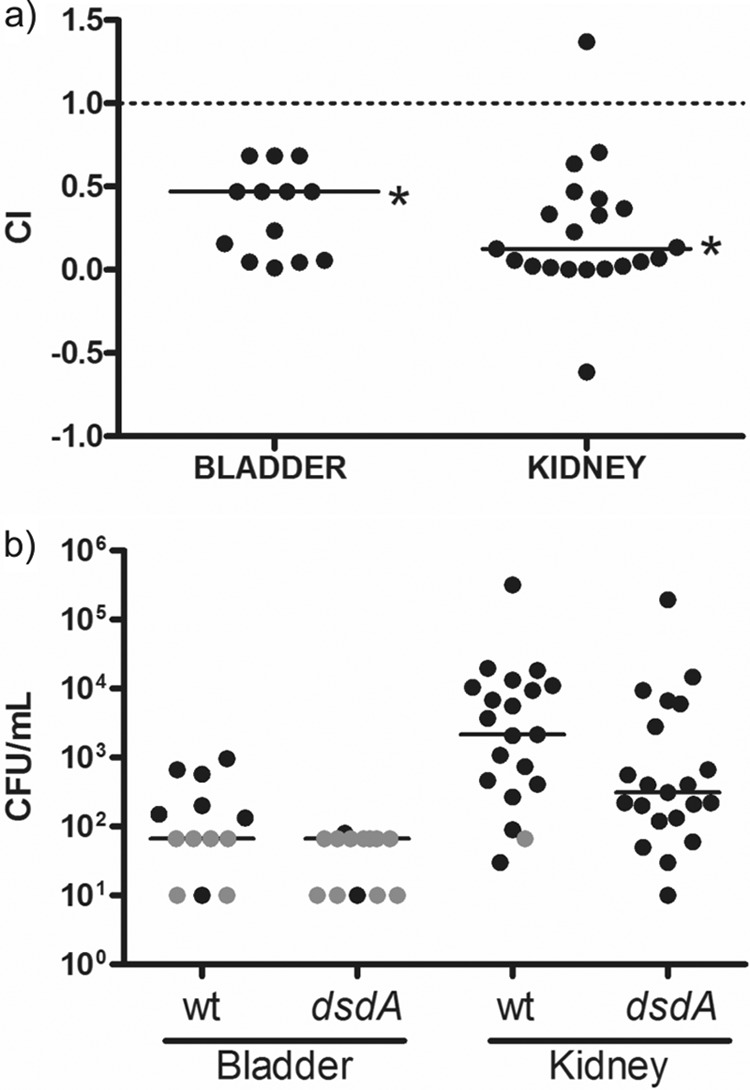
Fig 1.

(a) Competitive indices of coinfection experiments. Mice were infected by instillation with a mixture of cells of the wild type and the mutant, and competitive indices (CIs) were determined for bladders and kidneys. The dashed line represents equal numbers of CFU recovered from bladder and kidney. Median CIs, indicated by horizontal lines, were significantly lower than 1 (0.47 in bladders and 0.13 in kidneys), indicating a disadvantage of the mutant in these experiments. n = 13 for bladders and 21 for kidneys. *, P < 0.05 by Wilcoxon signed-rank test. (b) CFU data from coinfection experiments. n = 13 for bladders and 21 for kidneys. Horizontal lines represent the geometric mean titer of each sample (n = 13 for bladders and 21 for kidneys). Gray circles indicate samples in which no CFU were detected and for which the limit of detection of the protocol has been entered.
