Fig 4.
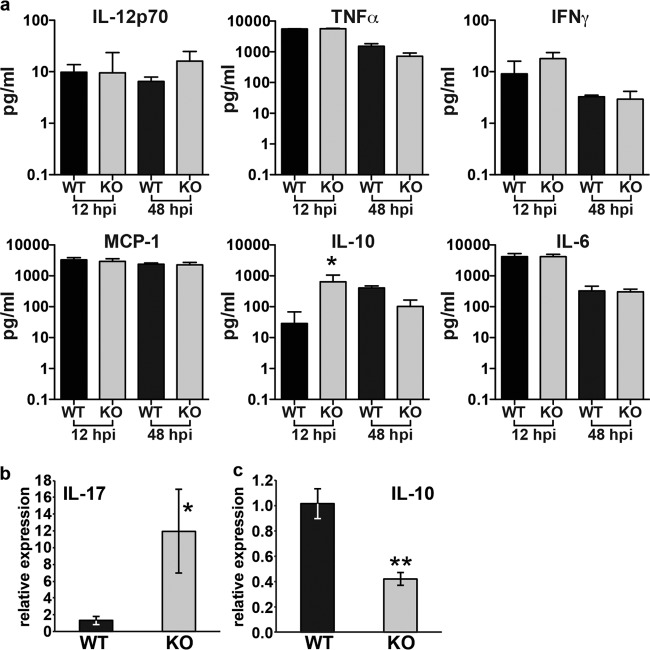
Cytokine analysis in lung lysates and BALF cells from Fus1+/+ (WT) and Fus1−/− (KO) mice at different time points postinfection. (a) Cytokine quantification in whole-lung lysates from A. baumannii-infected Fus1−/− and Fus1+/+ mice at 12 and 48 hpi. *, P < 0.05 (one-way analysis of variance). (b and c) Real-time PCR analysis of IL-17 and IL-10 transcript levels in BALF cells collected from Fus1−/− and Fus1+/+ lungs at 36 hpi with A. baumannii. Total RNA was isolated from BALF cells, and expression of the mRNA was analyzed by real-time PCR and normalized to the GusB gene. The bar graph shows relative levels of cytokine expression. The data represent means ± the standard errors (*, P ≤ 0.05) as determined by using the Student t test comparing Fus1+/+ to Fus1−/− (n = 3 to 5 mice per group).

