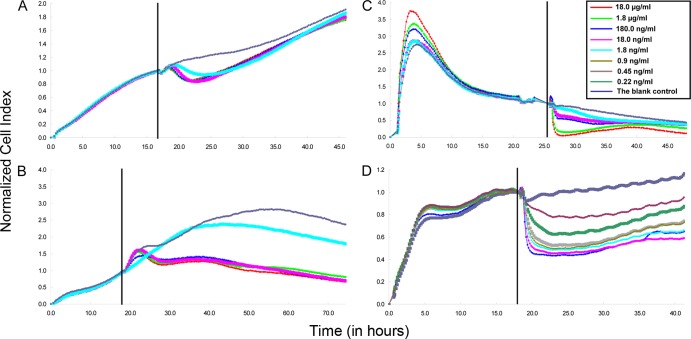
Fig 1.
Responses of four cell lines to CT. Each curve is representative of triplicate results. The growth curves corresponding to four cell lines, a Chinese hamster ovary cell line (A), a mouse adrenal gland cell line (B), a small intestine epithelial cell line (C), and the Y-1 mouse adrenal tumor cell line (D), were monitored in real time. The cellular changes were induced by serial dilutions of purified CT. The vertical lines indicate the time points at which the sample/toxin was added (t = 0).

