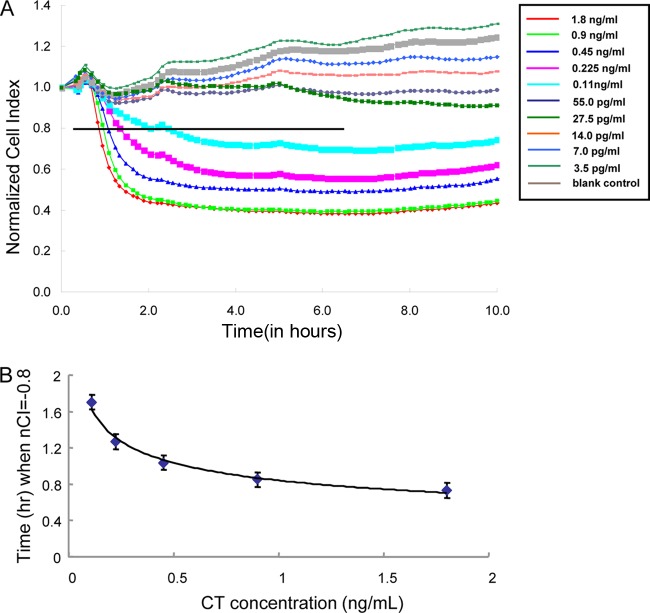
Fig 2.
Analytical sensitivity of CT diluted with pooled negative stool specimens, as detected by the RTCA assay using Y-1 cells. (A) Time- and concentration-dependent responses of the Y-1 line to CT, as monitored continuously with the RTCA system. The individual curves displayed are representative of triplicate results. The coefficient of variation of the nCI values is less than 5%. The y axis indicates the time point at which the sample/toxin was added (t = 0), and the x axis indicates the monitoring times. The horizontal line indicates the nCI 20% cutoff value. (B) Dependency of the time for a 20% decrease in nCI (y axis) in a well containing CT on the toxin concentration (x axis), as determined by nonlinear regression.

