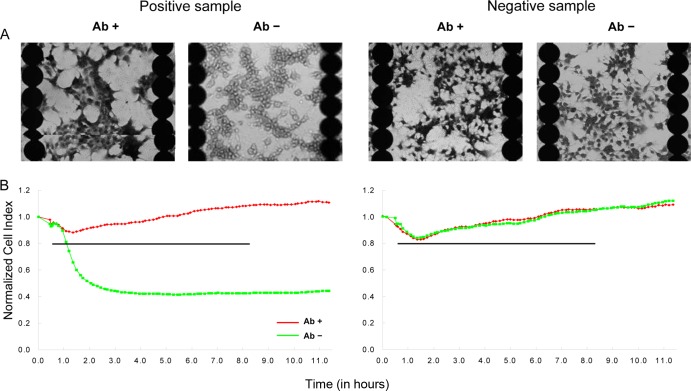
Fig 3.
Representative CT-RTCA results for isolates and clinical specimens. (A) Stained images of Y-1 cells seeded on 96-well E-Plates. (B) Real-time monitoring of the cytotoxic effects of CT on Y-1 cells by using the RTCA system. The specimens were tested by mixing them with neutralizing antibody (Ab+) or not (Ab−). The y axis indicates the time point at which the sample/toxin (t = 0) was added, and the x axis indicates the monitoring times. The horizontal line indicates the nCI 20% cutoff value.

