
Figure 2.
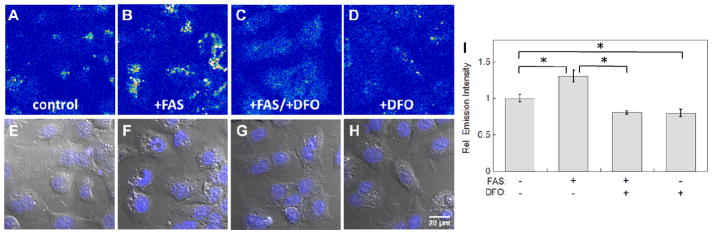
Representative confocal microscopy images of HepG2/C3A cells stained with 20 μM IP1-AM for 2 hrs. (A) Control cells. (B) Cells enriched with 100 μM ferrous ammonium sulfate (FAS) for 20 hrs. (C) Iron enriched cells treated with 50 μM DFO for 40 min. (D) Cells treated with 50 μM desferoxamine (DFO) for 40 min. (E–H) Overlays of bright field images and Hoechst stain in A–D. (I) Quantification of relative fluorescence intensity of confocal microscopy images of HepG2/C3A cells obtained under conditions A–D. Error bars are ±SD (n = 3). Statistical analysis was performed with a two-tailed Student’s t-test, *: p <0.001. Fluorescent intensity in images A–D is represented in a pseudo-color scale for better visual contrast.