
Figure 3.
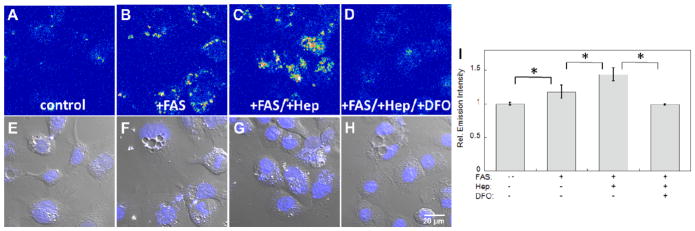
Representative confocal microscopy images of HepG2/C3A cells stained with 20 μM IP1-AM for 2 hrs. (A) Control cells. (B) Cells enriched with 100 μM ferrous ammonium sulfate (FAS) for 20 hrs. (C) Cells treated with 100 FAS for 1 hr, followed by addition of 0.5 μM hepcidin and co-incubated for a further 19 hrs. (D) Cells treated with FAS and hepcidin for 20 hrs and 19 hrs, respectively, and followed by a 40 min treatment with 50 μM desferoxamine (DFO). (E–H) Overlays of bright field images and Hoechst stain in A–D. (I) Quantification of relative fluorescence intensities of confocal microscopy images of HepG2/C3A cells obtained under conditions A–D. Error bars are ±SD (n = 3). Statistical analysis was performed with a two-tailed Student’s t-test, *: p <0.001. Fluorescent intensity in images A–D is represented in a pseudo-color scale for better visual contrast.