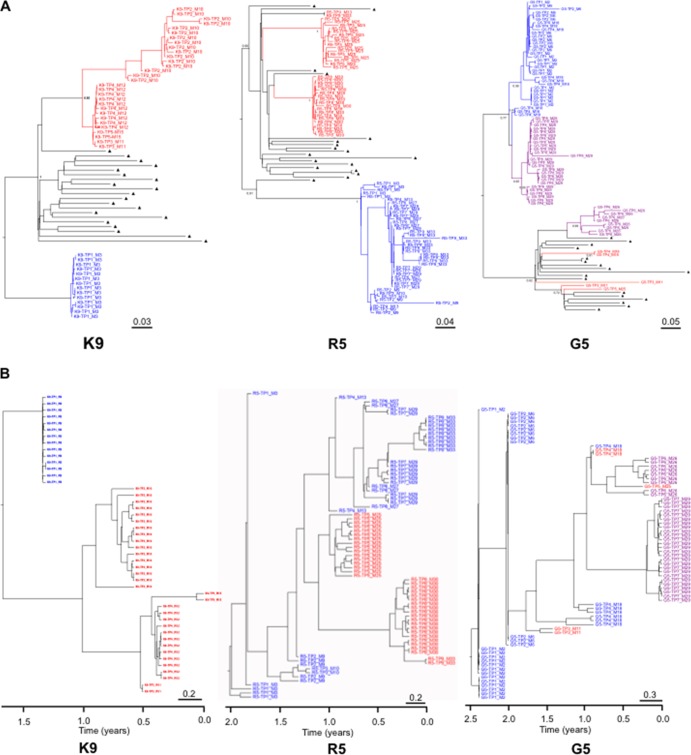
Fig 3.
(A) BMCMC tree of partial env sequences for individuals K9, R5, and G5. The sequences from the original lineage are depicted in blue. The sequences from the SI lineage are depicted in red, while those in purple represent potential recombinant sequences between original and SI strains. Background sequences are labeled with black triangles. Posterior probably of main lineages are indicated at the root. Tip labels indicate time points of sampling (TP) and month after infection (M). Scale bars represent genetic distances in substitutions/site. (B) Time-scaled BMCMC phylogenetic trees of partial env sequences for individuals K9, R5, and G5. The sequences from the original lineage are depicted in blue. The sequences from the SI lineage are depicted in red, while those in purple represent potential recombinant sequences between original and SI strains. Tip labels indicated time points of sampling (TP) and month after infection (M). The trees represent the ancestral relationships of sequences belonging to each lineage. The x axis represents time in years before the latest sampling date. Scale bars represent time in years.

