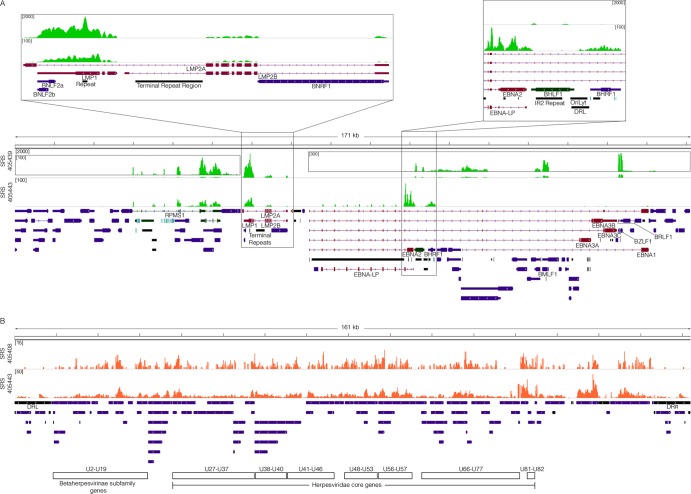
Fig 2.
Viral transcriptome. (A) EBV genome coverage data for EBV-positive DLBCLs. The y axis represents the number of reads at each nucleotide position. The modified EBV Akata genome was split between the BBLF2/3 and the BGLF3.5 lytic genes rather than at the terminal repeats to accommodate coverage of splice junctions for the latency membrane protein LMP2. The scale for sample SRS405439 is set to a maximum read level of 2,000 reads, with scales for the inset displays set to maximum read levels of 100 and 300 reads. The scale for sample SRS405443 is set to a maximum read level of 100 reads. Blue features represent lytic genes, red features represent latent genes, green features represent potential noncoding genes, aquamarine features represent microRNAs, and black features represent nongene features (e.g., repeat regions). (B) HHV-6B genome coverage data for HHV-6B-positive DLBCLs. The scale for sample SRS405408 is set to a maximum read level of 15 reads, while the scale for SRS405443 is set to 50 reads.

