
Fig 3.
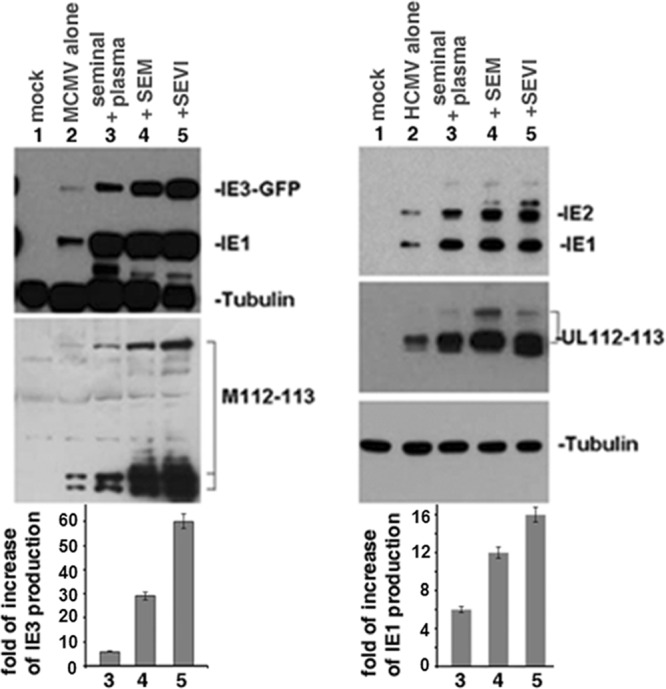
Western blot assay to detect viral protein production. (Left) NIH 3T3 cells were mock infected or infected with either MCMVE5gfp alone (MOI = 0.1) or MCMVE5gfp treated with SP, SEM amyloids, or SEVI for 24 h. Whole-cell lysates were prepared for Western blot with antibodies against GFP (IE3-GFP), IE1, M112-113, and tubulin (as loading control). (Right) MRC-5 cells were mock infected or infected either with HCMV alone or HCMV treated with SP, SEM amyloids, or SEVI; all infections were carried out for 24 h at an MOI of 0.1. Whole-cell lysates were prepared for Western blot with antibodies against IE1, IE2, UL112-113, and tubulin. By comparing the density of the IE3 bands of MCMV or the IE1 bands of HCMV with that of the virus alone (with all intensities normalized to the tubulin control), the fold increase of IE3 levels for MCMV (left) and that of IE1 for HCMV (right) were calculated (Quantity One 4.5.0 software; Bio-Rad Laboratories, Richmond, CA). Normalized IE3 (MCMV, left) or IE1 (HCMV, right) levels are shown below the corresponding Western blots.